130+ Performance Testing Interview Questions (2025)
Preparing for a Performance testing interview? You’re in the right place! Performance testing is an essential part of software development that ensures applications meet user expectations under varying conditions. Whether you are preparing for interviews or enhancing your knowledge in this area, understanding key performance testing interview questions can significantly improve your confidence.
Employers often seek candidates who not only understand the technical concepts but can also apply them effectively in real-world scenarios. This guide will help you prepare by covering commonly asked performance testing interview questions along with their practical relevance.
Performance Testing Interview Questions And Answers For Experienced & Freshers
Here is the list of 130+ Top Performance Testing interview questions and answers.
#1. What is Performance Testing?
In software, performance testing (also called Perf Testing) determines or validates the speed, scalability, and/or stability characteristics of the system or application under test. Performance is concerned with achieving response times, throughput, and resource-utilization levels that meet the performance objectives for the project or product.
Web application performance testing is conducted to mitigate the risk of availability, reliability, scalability, responsiveness, stability, etc. of a system.
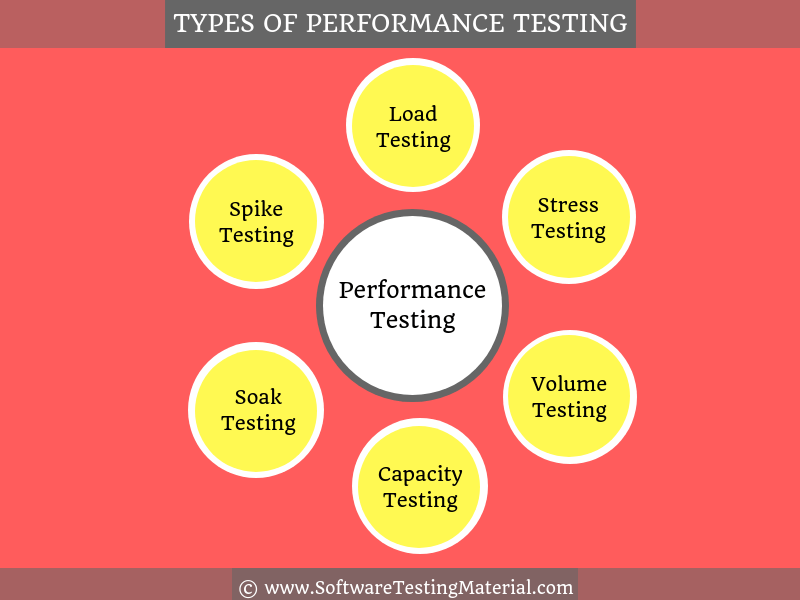
Performance testing encompasses a number of different types of testing like load testing, volume testing, stress testing, capacity testing, soak/endurance testing, and spike testing each of which is designed to uncover or solve performance problems in a system.
#2. Difference between Performance Engineering & Performance Testing?
Performance engineering is a discipline that includes best practices and activities during every phase of the software development life cycle (SDLC) in order to test and tune the application with the intent of realizing the required performance.
Performance testing simulates the realistic end-user load to determine the speed, responsiveness, and stability of the system. It concerned with testing and reporting the current performance of an application under various parameters such as response time, concurrent user load, server throughput, etc.
#3. What is performance tuning? What are the types of Performance Tuning?
Performance tuning is a process that focuses on the improvement of system performance.
There are two types of Performance Tuning.
1. Hardware Tuning: Optimizing, adding, or replacing the hardware components of the system to make improvements in the performance of the system is called hardware tuning.
2. Software Tuning: Identifying the software level bottlenecks by profiling the code, database, etc. With the help of fine-tuning or modifying the software to fix the bottlenecks is called software tuning.
#4. What is profiling in Performance Testing?
Profiling helps in fine-tuning the application by optimizing the code. The code must be analyzed, debugged, and reviewed to determine the most effective way to make it run faster.
#5. Name some common performance bottlenecks?
Performance bottlenecks often arise in various components of a system, impacting overall efficiency and reliability. Some common areas include:
- CPU Utilization – Excessive CPU usage can lead to slower system performance and delays in processing tasks.
- Memory Utilization – Insufficient or poorly managed memory can cause applications to crash or perform sluggishly.
- Networking Utilization – High network traffic or limited bandwidth can create latency issues and disrupt communication between systems.
- Software Limitations – Inefficient algorithms, unoptimized code, or software constraints can drastically reduce performance.
- Disk Usage – Heavy disk activity or limited read/write speeds can bottleneck data-intensive operations.
#6. What are the entry and exit criteria for Performance Testing?
Entry Criteria for Performance Testing
- Requirements Documentation: Clearly defined performance requirements and key performance indicators (KPIs) must be available.
- Test Environment Setup: A stable and reliable test environment replicating the production environment should be prepared.
- Test Data Preparation: Sufficient and realistic test data should be created and ready for use.
- Test Plan and Strategy: A detailed performance test plan, including scripts and tools to be used, must be in place.
- Access to System Under Test (SUT): The application or system to be tested should be accessible and ready for performance testing.
- Team and Tools Readiness: The required tools, frameworks, and testing team should be fully prepared to begin testing.
Exit Criteria for Performance Testing
- Meeting Performance Benchmarks: All pre-defined performance criteria, such as response time, throughput, and resource utilization, have been successfully met.
- Defect Resolution: All high-priority performance issues identified during testing have been resolved or acknowledged with mitigation plans in place.
- Test Completion Report: A comprehensive performance test report is prepared, detailing test outcomes, bottlenecks, and recommendations.
- Stakeholder Review: Test results have been reviewed and approved by stakeholders.
- Stable Environment: No further critical performance issues are identified, ensuring the system’s stability and readiness for deployment.
Performance testing ensures that the application operates efficiently under expected and peak loads, reducing the risk of failures in a live environment.
#7. What involves in Performance Testing Process
- Identify the test environment: Identify the physical test environment, production environment, and know what testing tools are available. Before beginning the testing process, understand the details of the hardware, software, and network configurations. This process must be revisited periodically throughout the project’s life cycle.
- Identify performance acceptance criteria: This includes goals and constraints for response time, throughput, and resource utilization. Response time is a user concern, throughput is a business concern, and resource utilization is a system concern. It is also necessary to identify project success criteria that may not be captured by those goals and constraints.
- Plan & Design performance tests: Identify key scenarios to test for all possible use cases. Determine how to simulate that variability, define test data, and establish metrics to be gathered.
- Configure the Test Environment: Prepare the test environment, arrange tools and other resources before execution
- Implement the Test Design: Develop the performance tests in accordance with the test design
- Execute the Test: Execute and monitor the tests
- Analyze Results, Report, and Retest: Consolidate, analyze, and share test results. Fine-tune and retest to see if there is an improvement in performance. When all of the metric values are within acceptable limits then you have finished testing that particular scenario on that particular configuration.
#8. When should we use performance testing?
Performance testing should be done during the development, during the QA process, prior to product release, after new releases, and marketing initiatives. The simple answer is any time when the system changes.
#9. Why should we automate performance testing?
Many performance testing tools in the market contain components used for performing automated testing. We get more time to spend on analyzing results while our build system does repetitive tasks using automation. Due to this repetitive automation tasks, it’s easier to test more regularly and can find issues early.
#10. Give some example of Performance Test Cases
Writing test cases for performance testing requires a different mindset compared to writing functional test cases.
Read more: How To Write Functional Test Cases
- To verify whether an application is capable of handling a certain number of simultaneous users
- To verify whether the response time of an application under load is within an acceptable range when the network connectivity is slow
- To verify the response time of an application under low, normal, moderate and heavy load conditions
- To check whether the server remain functional without any crash under high load
- To verify whether an application reverts to normal behavior after a peak load
- To verify database server and CPU and memory usage of the application under peak load
#11. What are the challenges faced during performance testing?
Some of the challenge we face during performance testing are as follows.
- Simulating Realistic User Behavior: Replicating real-world user interactions and usage patterns accurately can be difficult, leading to incomplete or skewed test results.
- Resource Constraints: Performance testing requires significant resources, including hardware, software, and skilled professionals, which can be a challenge for teams with limited budgets.
- Dynamic Environments: Modern applications often run in dynamic environments, such as cloud-based systems, making it harder to replicate and measure performance consistently.
- Identifying Bottlenecks: Pinpointing specific performance bottlenecks in complex systems can be time-consuming and requires advanced tools and expertise.
- Test Data Management: Generating and managing realistic and representative datasets for testing purposes involves additional effort and can impact the accuracy of results.
- Time Limitations: Performance testing can be a lengthy process, and project timelines may not always allow sufficient time for thorough testing.
- Third-Party Dependencies: Applications that rely on external APIs or third-party services can complicate testing due to factors outside the team’s control.
- Evolving Requirements: Frequent updates and changes to application features or infrastructure make it difficult to maintain consistent and effective testing strategies.
#12. How would you deal with resource constraints during performance testing?
Dealing with resource constraints during performance testing requires a strategic approach to maximize efficiency while ensuring test accuracy. One key tactic is prioritizing critical test scenarios to focus on areas that pose the highest risk or have the most significant impact on performance. Additionally, leveraging virtualization and cloud-based environments can help scale resources dynamically, providing flexibility without the need for extensive physical infrastructure. Resource pooling, where multiple teams share testing environments, can also optimize utilization. Monitoring tools should be used to identify bottlenecks and underutilized resources, enabling better allocation. Lastly, adopting a hybrid model of synthetic and real-user simulations ensures effective testing even with limited resources.
#13. How do you analyze the results of a performance test?
Analyzing the results of a performance test involves interpreting key performance metrics to assess system efficiency and reliability. Start by reviewing primary metrics such as response time, throughput, and system resource usage (CPU, memory, disk, and network). Look for any bottlenecks or anomalies that could indicate performance issues. Identify patterns in the data, such as consistent delays or elevated resource usage at specific loads, and compare these findings against the expected benchmarks or Service Level Agreements (SLAs).
Additionally, it is crucial to analyze error rates and failure responses during the test. High error rates or frequent failures under specific loads may indicate areas requiring further optimization. Use visualizations, such as graphs and charts, to map trends over time for better insights. Lastly, correlate the results with real-world scenarios to ensure that the system can handle anticipated user behaviors effectively and plan necessary improvements based on the findings.
#14. What are the phases involved in the Performance Testing Life Cycle?
The Performance Testing Life Cycle involves several critical phases to ensure a system meets the desired performance benchmarks. These phases are as follows:
- Requirement Gathering: During this phase, the performance testing requirements are identified. Key performance indicators (KPIs) such as response time, throughput, and resource utilization are defined based on business expectations.
- Test Planning: A detailed test plan is created, outlining the scope of testing, required tools, timelines, and test environment configurations. This phase ensures all stakeholders are aligned with the testing objectives.
- Test Environment Setup: The test environment is prepared to replicate the production environment as closely as possible. Hardware, software, and network configurations are established to simulate real-world conditions.
- Test Design and Development: Performance test scripts are developed based on the identified test scenarios. These scripts cover diverse workload distributions, stress conditions, and potential edge cases.
- Test Execution: The performance tests are executed using the prepared scripts. Load, stress, and endurance tests are conducted to analyze the system’s performance under varying conditions.
- Results Analysis and Reporting: Test results are collected, analyzed, and compared to predefined KPIs. The findings are documented in a detailed report, highlighting bottlenecks, system behavior, and recommendations for improvements.
- Tuning and Optimization: Based on the analysis, performance issues are addressed through tuning and optimization of the system. This may involve code changes, hardware enhancements, or configuration adjustments.
#15. Difference between Functional Testing and Non-functional Testing?
| Functional Testing | Non-functional Testing |
|---|---|
| What the system actually does is functional testing | How well the system performs is non-functionality testing |
| To ensure that your product meets customer and business requirements and doesn’t have any major bugs | To ensure that the product stands up to customer expectations |
| To verify the accuracy of the software against expected output | To verify the behavior of the software at various load conditions |
| It is performed before non-functional testing | It is performed after functional testing |
| Example of functional test case is to verify the login functionality | Example of non-functional test case is to check whether the homepage is loading in less than 2 seconds |
| Testing types are • Unit testing • Smoke testing • User Acceptance • Integration Testing • Regression testing • Localization • Globalization • Interoperability | Testing types are • Performance Testing • Volume Testing • Scalability • Usability Testing • Load Testing • Stress Testing • Compliance Testing • Portability Testing • Disaster Recover Testing |
| It can be performed either manual or automated way | It can be performed efficiently if automated |
#16. Difference between Performance Testing, Load Testing & Stress Testing
| Performance Testing | Load testing | Stress testing |
|---|---|---|
| It is a superset of load and stress testing | It is a subset of performance testing | It is a subset of performance testing |
| Goal of performance testing is to set the benchmark and standards for the application | Goal of load testing is to identify the upper limit of the system, set SLA of the app and check how the system handles heavy load | Goal of stress testing is to find how the system behaves under extreme loads and how it recovers from failure |
| Load limit is both below and above the threshold of a break | Load limit is a threshold of a break | Load limit is above the threshold of a break |
| The attributes which are checked in performance testing are speed, response time, resource usage, stability, reliability and throughput | The attributes which are checked in a load testing are peak performance, server throughput, response time under various load levels, load balancing requirements etc. | The attributes which are checked in a stress testing are stability response time, bandwidth capacity etc., |
#17. What are the different types of Performance Testing?
Types of Performance testing are as follows
- Load Testing: This type of performance testing evaluates how a system behaves under expected user loads. The goal is to identify bottlenecks and ensure that the application can handle anticipated traffic without degradation in performance.
- Stress Testing: Stress testing determines the system’s stability and behavior beyond normal or peak conditions. It helps identify the system’s breaking point and assesses how it recovers from failure scenarios.
- Endurance Testing (or Soak Testing): Endurance testing involves running the system at average load for an extended time to identify issues like memory leaks or performance degradation due to sustained use.
- Spike Testing: Spike testing examines the system’s performance when it experiences sudden and extreme increases in load. This test ensures the application can handle unexpected spikes without crashing or slowing down significantly.
- Volume Testing: Volume testing evaluates the system’s performance when large volumes of data are processed. The objective is to check for database limitations and performance issues related to data handling.
- Scalability Testing: Scalability testing checks the system’s ability to scale up or down in response to changes in user load. It measures the system’s capacity to handle growth efficiently.
#18. What is Load Testing?
Load Testing is done to verify that a system/application can handle the expected number of transactions and to verify the system/application behavior under both normal and peak load conditions (no. of users).
Load Testing is a subset of Performance Testing and is a type of non-functional testing.
Read more: Load Testing Complete Guide
#19. What is Scalability/Capacity Testing:
Capacity Testing is to determine how many users a system/application can handle successfully before the performance goals become unacceptable. This allows us to avoid potential problems in the future such as increased user base or increased volume of data. It helps users to identify a scaling strategy in order to determine whether a system should scale-up or scale-out. It is done majorly for eCommerce and Banking sites. are some examples. This testing is sometimes called Scalability testing.
#20. What is Volume Testing?
Volume Testing is to verify whether a system/application can handle a large amount of data. This testing focuses on Data Base. Performance tester who does volume testing has to populate a huge volume of data in a database and monitors the behavior of a system.
#21. What is Stress Testing?
Stress Testing is to verify the behavior of the system once the load increases more than the system’s design expectations. This testing addresses which components fail first when we stress the system by applying the load beyond the design expectations. So that we can design a more robust system.
#22. What is Soak/Endurance Testing?
Soak Testing is aka Endurance Testing. Running a system at a high load for a prolonged period of time to identify the performance problems is called Soak Testing. It is to make sure the software can handle the expected load over a long period of time.
#23. What is Spike Testing?
Spike Testing is to determine the behavior of the system under a sudden increase of load (a large number of users) on the system.
Read more: 100+ Types of Software Testing
#24. What is the purpose of Spike Testing?
Spike testing is designed to evaluate a system’s performance and stability under sudden and extreme increases in load. By introducing abrupt spikes in user activity or transaction volume, it helps identify how the system responds to rapid changes and whether it can recover effectively after the load returns to normal levels. The primary purpose of spike testing is to uncover performance bottlenecks, measure system resilience, and ensure that critical resources, such as memory and processing power, are not overwhelmed during unexpected load surges. This testing is critical for planning scalability and ensuring a seamless user experience, even under unpredictable conditions.
#25. What are some common performance problems users faces?
Some of the common performance problems faced by users are
- Slow Load Times: Delays in page or application load times can frustrate users, especially when speed is a critical expectation. Poor optimization, server issues, or heavy media files often contribute to this issue.
- Application Crashes: Frequent crashes or unresponsiveness can disrupt user experience, often caused by memory leaks, software bugs, or limited server resources.
- Latency Issues: High latency, particularly in real-time applications, results in noticeable delays during interactions, negatively impacting usability.
- Unstable Connections: Users may experience inconsistent service due to network interruptions, server failures, or lack of redundancy systems.
- Resource Consumption: Excessive use of CPU or memory by an application can lead to other system processes slowing down, making the user’s device sluggish and difficult to operate.
- Scalability Bottlenecks: When systems aren’t designed to handle increased traffic, users may encounter slow performance or service outages during peak usage times.
- Data Handling Delays: Inefficient database queries or poorly managed large datasets can lead to noticeable lags in retrieving or processing information.
#26. Name some parameters considered for Performance Testing?
When conducting performance testing, several critical parameters are taken into account to ensure systems meet performance expectations under various conditions. These include:
- Response Time: The time taken by the system to respond to a user request.
- Throughput: The amount of data processed by the system within a specified time frame.
- Concurrency: The number of users or transactions the system can handle simultaneously without degradation.
- Scalability: The system’s ability to handle an increasing workload by scaling up resources.
- Requests per Second: The number of requests processed by the system per second.
- Latency: The delay experienced when processing a request, particularly important in systems with real-time requirements.
- Error Rate: The frequency of errors encountered during system operations under load.
- Resource Utilization: Monitoring CPU, memory, and network usage to ensure efficient resource management.
#27. What are the factors considered for selecting performance tools?
Some factors considered for choosing the best performance testing tool for Performance Testing.
- Budget (License cost)
- Types of license
- Easy installation
- Protocol support
- Customer preference of load testing tool
- The cost involved in training employees on the selected tool
- Hardware/Software requirements of a loading tool
- Tool Vendor support and update policy
- Detailed Reporting
- Cloud integration
#28. Name some popular performance testing tools?
Several performance testing tools are widely used to identify and address system bottlenecks effectively. Some of the most popular tools include:
- JMeter – An open-source tool widely used for performance and load testing of web applications and other services.
- LoadRunner – A comprehensive performance testing tool from Micro Focus, often used for large-scale applications.
- Gatling – A powerful open-source tool designed to handle stress testing, particularly for web APIs.
- Apache Benchmark – A simple yet effective command-line tool for benchmarking HTTP servers.
- NeoLoad – A performance testing platform tailored for testing dynamic applications with complex loads.
- WebLOAD – A flexible tool designed for load and performance testing of enterprise-scale web applications.
- LoadView – A fully cloud-based performance testing solution that ensures scalability and flexibility for web applications.
- LoadUI Pro – Part of the ReadyAPI suite, it’s a performance testing tool ideal for testing APIs under heavy load.
#29. What is throughput in Performance Testing?
Throughput is one of the key metrics in performance testing. It refers to the amount of data transferred between the client and server at a given period of time, generally resulting as bits per second (bps).
Example: bits per second, bytes per second (Bps), kilobytes per second (KBps), megabytes per second (MBps), and gigabytes per second (GBps).
If a server receives 60 requests in one minute then the throughput is one request per second. If it receives 120 requests in one minute then the throughput is two requests per second. And so on.
#30. How do you calculate the throughput of a system in performance testing?
To calculate the throughput of a system in performance testing, you measure the total number of requests or transactions that the system processes over a specific time period. Throughput is typically expressed in terms of requests per second (RPS) or transactions per second (TPS). The formula to calculate throughput is:
Throughput (RPS or TPS) = Total Number of Requests or Transactions / Total Time PeriodFor example, if a system processes 1,000 requests in 100 seconds, the throughput is 10 requests per second. Accurately measuring throughput involves collecting data during performance testing scenarios and ensuring that the system is under stable load conditions. Additionally, tools like load testing software can automatically compute throughput and provide insights on performance metrics to facilitate analysis.
#31. Explain the concept of transaction per second (TPS) in performance testing?
Transaction Per Second (TPS) is a key metric in performance testing that quantifies the number of individual transactions a system processes within one second. A transaction typically refers to a single, complete interaction between the user and the system, such as completing a login, submitting a form, or retrieving data from a database.
Measuring TPS helps assess the efficiency and scalability of a system under varying loads. It provides insights into how well the system can handle concurrent transactions during peak usage periods.
To calculate TPS, performance tests are executed under controlled conditions, and tools are used to simulate realistic user behavior. High TPS values indicate a system capable of handling high volumes of work efficiently, while unusual dips in TPS could signify bottlenecks or performance issues that need to be addressed.
#32. What do concurrent users mean in performance testing?
Concurrent users in performance testing refer to the total number of users actively interacting with an application or system at the same time. These users perform various operations, such as clicking, browsing, or submitting data, which can place a varying level of demand on the application. Measuring concurrent users helps determine an application’s capacity to handle simultaneous activity, ensuring it remains stable and performs efficiently under expected or peak usage conditions. This metric is crucial for identifying bottlenecks and optimizing the system to prevent crashes or slowdowns during real-world usage scenarios.
#33. What is the protocol in performance testing?
A protocol is a set of rules and conventions used to enable communication between devices in a network. It standardizes the format, timing, sequencing, and error handling of messages to ensure that devices can communicate effectively and reliably. Protocols are essential for the seamless exchange of data and instructions across different systems and platforms.
Some of the Protocols are:
- HTTP (Hypertext Transfer Protocol): Used for transferring web pages and other data over the Internet.
- FTP (File Transfer Protocol): Used for transferring files between a client and a server.
- SMTP (Simple Mail Transfer Protocol): Used for sending emails.
- TCP/IP (Transmission Control Protocol/Internet Protocol): A foundational suite of protocols used for communication across interconnected networks.
- DNS (Domain Name System): Translates domain names into IP addresses for locating and identifying devices on the network.
- SSL/TLS (Secure Sockets Layer/Transport Layer Security): Ensures secure communication over a network by encrypting data.
#34. What is a parameterization in performance testing?
Parameterization is used to replace the hardcoded values in the script with a parameter.
#35. What is the correlation in performance testing?
Correlation is used to capture dynamic values in the test script in performance testing and prevent the scripts from failing during execution. If a value changes for each user action when an action is replayed by the same or different user is known as a dynamic value.
#36. What is baseline testing in performance testing?
This testing is done on an application before coming to any conclusion and to get a reference for our further tests. These tests should help us determine what response is normal for the server. We can then use these values to set up the assertion in other tests.
#37. What is the Benchmark Testing in performance testing?
Benchmark testing is the process of comparing the performance of software or hardware against industry standards that are set by other organizations.
Here I am going to conclude this Performance Testing Interview Questions post. If you find that I didn’t cover some questions, please let me know in the comment section below. I will try to update this Performance Testing Interview Questions & Answers.
#38. What are the factors for selecting Performance Testing Tools?
When selecting performance testing tools, several factors should be considered to ensure the tool aligns with the testing requirements and the system’s needs:
- Compatibility with the Application Technology Stack: The tool should support the technologies used in the application, such as web, mobile, database, and cloud platforms.
- Scalability: It is essential to choose a tool capable of simulating the expected user load and scaling for future requirements as the application grows.
- Ease of Use: Tools with an intuitive interface and minimal learning curve enable quicker adoption by the team and more efficient test execution.
- Support for Multiple Protocols: A versatile tool should support a variety of protocols like HTTP(S), FTP, WebSockets, and others to cater to different system demands.
- Integration Capabilities: Seamless integration with CI/CD pipelines, version control systems, and monitoring tools enhances the overall testing process.
- Reporting and Analytics: Detailed and customizable reports help in identifying bottlenecks, analyzing performance metrics, and making data-driven decisions.
- Cost and Licensing: Consideration of the tool’s cost, licensing model, and long-term value is crucial for staying within budget while meeting testing needs.
- Community Support and Documentation: Robust documentation, active community forums, and vendor support ensure timely issue resolution and ongoing assistance during implementation.
By evaluating these factors, teams can select the most appropriate performance testing tool to address their specific needs, ensuring effective and reliable performance testing.
#39. What are the common mistakes done in Performance Testing?
Performance testing is a crucial aspect of ensuring the reliability and efficiency of systems under load. However, several common mistakes can undermine the effectiveness of this process:
- Lack of Clear Objectives – Failing to define precise goals for performance testing can lead to ambiguous results and misinterpretation of data. Clear benchmarks and success criteria should be established before starting.
- Testing in a Non-Production Environment – Using a testing environment that does not closely replicate the production environment can result in inaccurate performance metrics, as real-world conditions are not adequately simulated.
- Insufficient Test Data – Conducting performance testing with inadequate or unrepresentative data can distort the outcomes and fail to reveal potential issues. It is essential to use realistic data volumes and patterns that reflect actual usage scenarios to ensure accurate and reliable results.
- Ignoring User Behavior Patterns – Performance testing that does not account for typical user interactions with the system may overlook critical bottlenecks related to real-world usage scenarios.
- Insufficient Load Testing – Applying an insufficient or unrealistic load during tests may fail to identify breaking points, while applying an excessive, unrepresentative load can waste resources and miss the actual performance limits.
- Overlooking Background Processes – Ignoring the impact of background tasks, such as scheduled jobs or system maintenance processes, can lead to incomplete performance evaluations.
- Failure to Monitor All Metrics – Concentrating solely on response time and throughput while neglecting CPU, memory, and network utilization may result in missed performance issues.
- Lack of Regular Testing – Performance testing conducted only during late phases of development may surface issues too late, making it difficult to address them efficiently.
By avoiding these mistakes, teams can improve the accuracy of performance testing and ensure their systems meet the necessary standards of reliability and scalability.
#40. Explain the difference between endurance testing and spike testing?
| Aspect | Endurance Testing | Spike Testing |
|---|---|---|
| Definition | Evaluates a system’s performance over an extended period under a steady load. | Assesses a system’s behavior under a sudden and extreme increase in load. |
| Purpose | Identifies issues such as memory leaks or resource depletion over time. | Tests the system’s ability to handle bursts of high traffic or demand. |
| Load Pattern | Maintains a consistent level of load for a prolonged duration. | Introduces rapid, unexpected spikes in load to simulate traffic bursts. |
| Focus | Long-term stability and resource management of the system. | Scalability and adaptability to sudden changes in demand. |
| Outcome | Ensures the system remains stable under continuous use. | Verifies that the system can recover and perform after a sudden surge. |
#41. What is the difference between Performance Testing & Functional Testing?
| Aspect | Performance Testing | Functional Testing |
|---|---|---|
| Purpose | Evaluates the speed, responsiveness, and stability of the system under load. | Verifies that the system behaves as expected and meets specified requirements. |
| Focus | Non-functional aspects like scalability, reliability, and resource usage. | Functional aspects such as accurate operations, data integrity, and user flows. |
| Metrics Measured | Metrics like response time, throughput, and maximum user load. | Ensures features and functionality work as intended (pass/fail criteria). |
| Tools | Performance testing tools like JMeter, LoadRunner, or Gatling. | Functional testing tools like Selenium, QTP, or manual testing. |
| Test Conditions | Simulates varying loads and stress scenarios. | Tests under normal or specified user scenarios. |
| Outcome | Identifies bottlenecks and ensures optimal performance. | Confirms the system adheres to the functional requirements. |
#42. What is the difference between Benchmark Testing & Baseline Testing?
| Aspect | Benchmark Testing | Baseline Testing |
|---|---|---|
| Definition | Compares the system performance against a set industry standard or reference. | Measures the performance of a system as a starting point for future comparisons. |
| Purpose | To evaluate if the system meets predefined standards or outperforms competitors. | To establish a reference point to track performance improvements or degradations. |
| Focus | Focuses on achieving optimal performance based on external benchmarks. | Focuses on assessing and recording the system’s initial performance metrics. |
| Use Case | Used to establish competitive performance advantages or validate against industry norms. | Used to monitor system changes, upgrades, or optimizations over time. |
| Outcome | Identifies how the system aligns with or exceeds industry standards. | Provides a baseline for analyzing trends and identifying regressions. |
#43. What is the difference between performance testing and scalability testing?
| Aspect | Performance Testing | Scalability Testing |
|---|---|---|
| Definition | Evaluates how an application performs under specific conditions, such as load, stress, and response time. | Assesses an application’s ability to handle increased workloads or scales gracefully with added demand. |
| Focus | Focuses on speed, stability, and responsiveness under pre-defined conditions. | Focuses on growth capacity, system limits, and efficiency during scaling. |
| Objective | Ensures the application meets performance benchmarks and user expectations. | Determines system behavior and robustness as demand or infrastructure changes. |
| Measured Metrics | Includes response time, throughput, latency, and resource utilization. | Includes system scalability limits like maximum load, resource usage trends, and performance during scaling. |
| Scenarios Tested | Specific, controlled environments such as high traffic or data loads. | Scenarios where additional resources are introduced (e.g., hardware or software changes). |
| Outcome | Identifies bottlenecks and improves performance under normal or peak usage. | Determines whether the system can scale effectively and efficiently without performance degradation. |
#44. What is the difference between concurrent users and simultaneous users?
| Aspect | Concurrent Users | Simultaneous Users |
|---|---|---|
| Definition | Refers to users who are actively using a system or application within the same time frame, but not necessarily performing actions at the exact same moment. | Refers to users who are performing actions at precisely the same moment in the system or application. |
| Action Timing | Actions may overlap but do not have to occur at the exact same moment. | Actions occur at the exact same moment. |
| System Load | Represents a broader load on the system over a period of time. | Represents a more specific and instantaneous spike in system load. |
| Use Case | Used for testing sustained performance under real-world conditions where user actions are distributed. | Used for stress testing specific scenarios like transaction processing at the same time. |
#45. What is the difference between reliability testing and performance testing?
| Aspect | Reliability Testing | Performance Testing |
|---|---|---|
| Definition | Ensures the software system performs consistently over a specific period under predefined conditions. | Evaluates the speed, scalability, and stability of a system under various workloads. |
| Objective | Focuses on identifying and fixing issues that might cause downtime or disruptions in system availability. | Analyzes how well the system handles tasks to meet performance requirements under varying conditions. |
| Primary Goal | Measures system stability and fault tolerance. | Measures response time, throughput, and resource utilization. |
| Scope | Long-term assessment to ensure endurance and dependability. | Short-term to medium-term tests focusing on peak and average loads. |
| Key Metrics | Uptime, failure rate, mean time between failures (MTBF). | Response time, transactions per second, concurrent users. |
| Scenario Testing | Simulates prolonged usage, including normal and unexpected usage scenarios. | Simulates varying user loads to test system performance in different conditions. |
#46. What is load tuning?
Load tuning is the process of optimizing a system’s performance by adjusting various parameters to handle a specific load effectively. It involves identifying bottlenecks, allocating resources appropriately, and fine-tuning configurations to ensure the system can manage the expected user activity or transaction volume without degradation in performance. This process is crucial in performance testing to achieve system stability and enhance responsiveness under varying levels of load conditions.
#47. What is distributed testing?
Distributed testing is a method of performance testing where the testing process is executed across multiple machines or servers working in coordination. This approach is used to simulate large-scale user interactions or transaction loads that cannot be effectively generated by a single machine due to resource limitations. By distributing the load among multiple systems, distributed testing ensures that the test environment can emulate real-world scenarios more accurately, analyzing system behavior under heavy or geographically dispersed usage conditions. Tools such as Apache JMeter and LoadRunner often support distributed testing setups, enabling comprehensive analysis and better scalability assessments.
#48. What is NeoLoad?
Tricentis NeoLoad is a powerful performance and load testing tool designed to help organizations ensure the scalability and reliability of web, mobile, and packaged applications. It allows testers and developers to simulate user behavior under different loads, providing accurate insights into how an application will perform in real-world conditions. NeoLoad supports integrations with continuous integration and delivery (CI/CD) pipelines, making it an essential tool for agile and DevOps practices. By identifying bottlenecks and performance issues early, NeoLoad helps teams deliver high-quality applications with confidence.
#49. Difference Between Automatic Correlation and Manual Correlation
Automatic Correlation: This method involves using predefined rules or configurations within the testing tool to automatically identify and handle dynamic values during script recording or replay. It simplifies the process by reducing manual effort, making it faster and more efficient. However, it relies heavily on the accuracy of correlation rules defined in the tool, and complex cases may require further customization.
Manual Correlation: This approach requires the tester to manually identify dynamic values, determine their sources, and replace them with correlation parameters in the script. While it is more time-consuming and requires a deeper understanding of the script and the application’s behavior, it offers greater flexibility and control. Manual correlation is often used when automatic correlation fails to address specific scenarios or unique application requirements.
#50. Why concurrent user hits is important in the load testing?
Concurrent user hits are crucial in load testing because they help determine the application’s ability to handle simultaneous requests effectively. By simulating scenarios where multiple users interact with the application at the same time, testers can identify potential bottlenecks, performance limitations, and areas of improvement. This ensures that the application can maintain optimal performance under real-world conditions, providing a seamless user experience. Additionally, understanding the impact of concurrent user hits allows developers to predict scalability requirements and optimize system resources, ensuring reliability and stability even during peak usage periods.
#51. Explain the concept of virtual users in performance testing?
Virtual users in performance testing are simulated users created by software tools to mimic real-world user behavior on an application or system. These virtual users interact with the application by performing specific actions, such as logging in, navigating pages, or submitting data, just as actual users would. The purpose of virtual users is to test how the application performs under various levels of load and stress, identifying potential bottlenecks and areas for improvement. By scaling the number of virtual users, testers can replicate scenarios ranging from typical user traffic to extreme usage conditions, ensuring the application handles both expected and peak demand efficiently.
#52. What are the limitations of using virtual users in performance testing?
While virtual users are invaluable for performance testing, they do have certain limitations. One key limitation is that virtual users often cannot fully replicate the behavior and complexity of real-world users, such as human interaction patterns, network conditions, or device diversity. Additionally, the testing environment may not mirror a live production environment, leading to discrepancies in results and potential blind spots in the application’s performance. Resource constraints can also impact the accuracy of testing, as generating a high number of virtual users requires significant computing power and infrastructure. Finally, the dependency on predefined scripts for virtual user actions can limit flexibility, potentially missing unforeseen behaviors that real users might exhibit. These factors can lead to gaps in understanding the true performance and scalability of an application.
#53. Why is Capacity Planning Important?
Capacity planning is critical for ensuring that IT infrastructure aligns with both current and future business needs. Proper capacity planning helps organizations avoid over-provisioning, which leads to unnecessary costs, and under-provisioning, which can result in performance bottlenecks and downtime. By predicting resource demands and planning accordingly, businesses can maintain optimal performance levels, improve user satisfaction, and sustain operational efficiency under varying workloads. Effective capacity planning also supports scalability, ensuring that systems can adapt to growth and unexpected usage spikes seamlessly.
#54. What is rendezvous points in performance testing?
Rendezvous points are specific markers used in performance testing to synchronize virtual users during a test scenario. These points instruct multiple virtual users to perform a certain action at the same time, creating a concentrated load on the server at a particular moment. This helps simulate real-world scenarios where multiple users might interact with the server simultaneously, such as during a major event or peak usage period. By implementing rendezvous points, testers can assess how the application behaves under these sudden bursts of concurrent user activity, identifying potential performance bottlenecks or failures.
#55. What are the correlation graph and overlay graph?
Correlation graph: A correlation graph is used to identify the relationship between two variables during performance testing. It helps testers analyze how one variable influences another, which is crucial for determining bottlenecks in an application. For example, testers might correlate response times with the number of simultaneous users to assess system performance under load.
Overlay graph: An overlay graph, on the other hand, is used to compare multiple metrics on the same graph by plotting them together. This allows testers to visualize patterns or trends more clearly and identify how various parameters interact over time. For instance, overlaying CPU utilization with memory usage helps to better understand system resource consumption during test execution. Both graphs play an essential role in performance analysis by providing deeper insights into system behavior.
#56. What is Latency in Performance Testing?
Latency in performance testing refers to the time it takes for a request to travel from the client to the server and for the server to respond back to the client. This measurement, often expressed in milliseconds, is crucial for evaluating the responsiveness of a system. Low latency indicates that the system is fast and responsive, while high latency could signify delays that might impact the user experience. It is important to differentiate latency from other metrics such as throughput or response time, as latency specifically focuses on the communication delay between the client and server, excluding processing time. Monitoring and optimizing latency is a key aspect of performance testing to ensure systems meet user expectations and operational requirements.
#57. What is the role of network latency in performance testing?
Network latency plays a critical role in performance testing as it directly impacts the responsiveness and perceived speed of a system. High latency can lead to lagging interactions, causing delays in data transfer and reducing the overall efficiency of the system. During performance testing, simulating different levels of network latency helps identify how the system behaves under various conditions, including those with suboptimal network performance. By analyzing and optimizing for latency, testers can ensure that the system delivers a reliable and seamless experience for end-users, even in environments with fluctuating network conditions. This insight is vital for applications where real-time communication or fast data exchange is crucial.
#58. What is the best approach to analyzing database performance during performance testing?
To analyze database performance during performance testing, it is essential to monitor key metrics such as query response time, throughput, and resource utilization. First, identify and track slow-running queries by using database profiling tools or query execution plans to pinpoint inefficiencies. Measure the database’s throughput to understand how many transactions it can handle within a given timeframe, ensuring it aligns with performance benchmarks. Resource utilization metrics, including CPU, memory, and disk I/O usage, should be evaluated to detect bottlenecks or potential areas of failure under peak load conditions. Simulating real-world usage patterns, such as concurrent user transactions and varying data volumes, can help assess how the database behaves under stress. Leveraging monitoring tools and database logs provides further insights into connections, locks, and potential deadlocks. This comprehensive approach helps optimize database configurations, index strategies, and query designs to ensure high performance and reliability.
#59. What is the best way to calculate a system’s maximum load capacity?
Determining the maximum load capacity of a system involves conducting comprehensive load testing to evaluate its performance under increasing levels of demand. The process typically starts by simulating real-world user scenarios to understand baseline performance metrics. Gradually, the load is increased to identify the point where the system begins to show signs of strain, such as slower response times, increased error rates, or resource exhaustion. Key performance indicators (KPIs) such as CPU usage, memory consumption, and network bandwidth are closely monitored throughout the process. Additionally, stress testing is often used to push the system beyond its known limits, ensuring the identification of potential failure points and bottlenecks. Proper analysis of these tests provides a clear understanding of the system’s maximum capacity and informs decisions on necessary optimizations or capacity upgrades.
#60. What are the different types of performance testing scripts?
Performance testing scripts can be categorized into several types depending on the goal of the test and the specific performance metrics being measured. These include:
- Load Testing Scripts – Designed to simulate the expected user load on a system, these scripts help determine how the system performs under normal and peak conditions.
- Stress Testing Scripts – These scripts push the system beyond its normal operational limits to identify breaking points and uncover hidden issues related to hardware, software, or configurations.
- Endurance Testing Scripts – Also known as soak testing scripts, these are used to evaluate how a system behaves under a sustained load over a prolonged period, ensuring stability and reliability.
- Spike Testing Scripts – These scripts simulate sudden, extreme increases in user activity to test how the system handles rapid spikes in demand.
- Scalability Testing Scripts – These scripts assess the system’s ability to scale up or down in response to changes in user load or resource availability.
- Volume Testing Scripts – Designed to test the system’s performance when subjected to a large volume of data, these scripts help identify issues related to data handling and processing.
Creating and executing these scripts effectively requires a thorough understanding of the system under test and the specific objectives of the performance testing effort.
#61. How do you handle dynamic data in performance testing scenarios?
Dynamic data plays a crucial role in performance testing, ensuring that tests accurately simulate real-world user behavior. Proper management of dynamic data helps in reducing errors and enhances the reliability of test results. Below are key approaches to handle dynamic data effectively:
- Parameterization: Parameterization involves replacing static values in test scripts with dynamic variables. This allows testers to avoid hardcoding data and enables multiple iterations with varying inputs, such as unique user credentials, search queries, or form submissions. Tools like JMeter or LoadRunner provide built-in support for parameterization through test data files or variable references.
- Correlation: Correlation is used to manage dynamic server responses such as session IDs, tokens, or dynamic URLs. By capturing these values at runtime and reusing them in subsequent requests, testers can maintain session integrity and enable seamless communication between client and server. Most performance testing tools offer correlation features, either through automatic detection or manual scripting.
- Data-Driven Testing: Data-driven testing involves using external data sources, such as CSV files, Excel sheets, or databases, to supply test inputs dynamically. This approach supports testing with a wide range of realistic data sets, ensuring diversity and improving test coverage. Test tools can be configured to read these inputs and apply them to scripts effortlessly.
- Scripting Logic for Dynamic Scenarios: Custom scripting logic can be implemented to handle complex dynamic data scenarios. For example, calculating timestamps, generating unique identifiers, or processing dynamic values at runtime may require advanced scripting using languages like JavaScript, Python, or Groovy.
- Validation of Dynamic Data: It is essential to validate dynamic data captured during the execution of tests. For instance, verifying that session IDs or tokens are correctly generated and reused can prevent unexpected server-side errors or failed test cases. Validation rules can be integrated into scripts for automated checks.
By effectively managing dynamic data, performance testing becomes more aligned with real-world conditions, leading to accurate and actionable insights into application performance.
#62. How do you identify and troubleshoot performance bottlenecks in a distributed system?
- Monitor system performance metrics: Use monitoring tools to track CPU usage, memory consumption, network latency, and disk I/O. This helps in identifying which component of the system is under stress.
- Analyze logs: Review application and system logs to detect errors, timeouts, or unusual behavior that could indicate bottlenecks.
- Utilize distributed tracing: Implement tracing tools to follow requests as they move through various services in the system, pinpointing where delays occur.
- Perform load testing: Simulate real-world traffic patterns to understand how the system behaves under load and identify components that fail to scale.
- Examine database queries: Evaluate the efficiency of database queries and indexing, as database performance can often be a critical bottleneck in distributed systems.
- Check for resource contention: Identify shared resources that multiple services depend on, such as shared caches or files, and check for contention or locking issues.
- Optimize network communication: Assess communication between services to ensure that latency is minimized and that protocols and data serialization techniques are efficient.
- Scale critical components: Use horizontal or vertical scaling for system components that are overloaded or unable to handle peak demand.
- Review system architecture: Identify architectural inefficiencies, such as single points of failure or non-optimal service dependencies, that could impact performance.
- Conduct regular performance reviews: Continuously evaluate system performance over time as usage patterns and business requirements evolve.
#63. How do response time and latency differ in performance testing?
| Aspect | Response Time | Latency |
|---|---|---|
| Definition | The total time taken to complete a request from the user’s perspective. | The time it takes for a request to travel from the source to the destination and back. |
| Scope | Includes latency, processing time, and any additional delays in the system. | Focuses solely on the network or communication delay between two points. |
| Measurement Point | Measured from the user or client-end perspective. | Measured at the network level or between specific system components. |
| User Impact | Directly impacts user experience, as it reflects the total wait time. | Indirectly affects user experience by contributing to the overall response time. |
| Context | Evaluated under real-world application performance scenarios. | Evaluated to analyze network or transmission efficiency. |
#64. What are the best approaches to simulating realistic loads in performance testing?
- Identify key user scenarios to determine the most common actions performed by users on the system.
- Use real-world data about usage patterns, including peak traffic times and concurrent user behavior.
- Employ performance testing tools, such as JMeter, LoadRunner, or Gatling, to simulate virtual users and their interactions with the system.
- Incorporate varied data inputs to mimic diverse user behaviors and conditions during testing.
- Gradually increase load levels to simulate scaling and monitor how the system handles stress over time.
- Include think-time for virtual users to replicate realistic delays between user actions.
- Test with different network conditions, such as varying bandwidth and latency, to emulate a range of user environments.
- Run tests on real devices, if applicable, to account for hardware and software variations.
- Use the results to refine scenarios and ensure the simulation reflects actual user activities accurately.
#65. What is the purpose of a performance testing framework?
A performance testing framework is designed to evaluate the efficiency, stability, scalability, and responsiveness of a system under various conditions. It provides a structured approach to simulate real-world user interactions, measure system performance, and identify potential bottlenecks or areas for improvement. By utilizing this framework, teams can ensure that software meets predefined performance criteria, supports expected user loads, and remains reliable across different environments. Additionally, it enables consistent reporting and analysis, helping developers and stakeholders make informed decisions to optimize system performance.
#66. Explain the concept of think time in performance testing?
Think time refers to the simulated delay or pause a user takes between consecutive actions while interacting with a system or application during performance testing. This concept mirrors real-world user behavior, as actual users typically require time to read content, make decisions, or complete steps before proceeding to the next action. Incorporating think time into performance tests is crucial for creating realistic usage patterns, ensuring that test scenarios reflect actual user interactions. By accurately modeling think time, testers can better predict system performance under typical user conditions and avoid overestimating system load due to unrealistic, continuous action sequences. This leads to more reliable and actionable insights into the system’s capabilities.
#67. How do you perform performance testing for cloud-based applications?
Steps to perform performance testing for cloud-based applications are as follows.
- Define Objectives and Key Metrics: Start by identifying the objectives of the performance testing. Determine key performance indicators (KPIs) such as response time, throughput, scalability, and system availability that need to be measured.
- Select the Right Tools: Choose performance testing tools designed for cloud environments. Popular tools include Apache JMeter, LoadRunner, and Gatling, which can simulate virtual users and analyze system performance.
- Design Realistic Test Scenarios: Create test scenarios that mimic real-world usage patterns, including varied user behaviors, geographical distribution, and simultaneous operations. Incorporate think time into these scenarios to emulate realistic user interactions.
- Provision Cloud Resources: Configure the cloud infrastructure to mirror the production environment. Leverage the on-demand scalability features of cloud platforms to allocate resources dynamically during the test.
- Conduct Load and Stress Testing: Perform load testing to determine how the application behaves under normal loads and stress testing to evaluate its limits under peak loads. Monitor key metrics like CPU usage, memory consumption, and response times during these tests.
- Analyze Results and Optimize: Analyze the data gathered to identify performance bottlenecks, such as latency issues or resource constraints. Use this information to optimize the application and infrastructure for better performance.
- Iterate and Revalidate: After making enhancements, repeat the testing process to ensure that the changes have resolved issues without introducing new ones. Revalidate to confirm improved performance under similar or increased load conditions.
By following these steps, teams can ensure their cloud-based applications perform reliably and efficiently in diverse and dynamic usage scenarios.
#68. What challenges arise in performance testing within cloud environments?
Performance testing in cloud environments introduces unique challenges due to the dynamic and distributed nature of these platforms. Below are some of the key challenges categorized into subtopics:
- Resource Variability: Cloud environments are inherently dynamic, with resources scaling up or down based on demand. This variability can cause inconsistencies in test results. The same performance test might yield different outcomes at different times due to fluctuating resource availability, making it harder to pinpoint the true performance of the application.
- Cost Management: While cloud platforms offer scalability, running extensive performance tests can incur significant costs. Prolonged tests that simulate high levels of user activity often require substantial computational power, storage, and bandwidth, which can lead to increased expenses. Balancing thorough testing with cost efficiency is a constant challenge.
- Environment Configuration: Replicating a production-like environment in the cloud for performance testing can be complex. Differences in network configurations, regional data centers, or virtual machine setups might not perfectly mimic real-world conditions, potentially compromising the accuracy of test results.
- Monitoring and Data Collection: Cloud environments typically include distributed resources and multiple components, making it challenging to monitor performance comprehensively. Gathering performance metrics across different nodes, services, or regions requires robust tools and strategies, which can add to the complexity of the testing process.
- Network Latency and Bandwidth: Since cloud services rely heavily on network communication, testing accurately under different network conditions is critical. Simulating real-world bandwidth limitations and managing latency between services are difficult yet vital aspects of ensuring performance reliability in cloud applications.
- Dynamic Scaling Effects: Cloud applications often rely on auto-scaling, a feature that dynamically adjusts resources based on traffic or workload. Testing how an application performs during scaling events, such as traffic spikes, can be challenging. Ensuring the system maintains stability and responsiveness during these transitions requires precise scenario modeling.
- Vendor-Specific Limitations: Each cloud provider has its own set of features, APIs, and limitations. These differences can create compatibility issues or necessitate platform-specific configurations for performance testing. Additionally, reliance on proprietary tools provided by vendors may limit flexibility.
Addressing these challenges requires careful planning, the use of advanced tools, and collaboration between testing teams and cloud service providers to ensure that performance testing in cloud environments yields meaningful and actionable results.
#69. What are Performance Counters in Performance Testing?
Performance counters are metrics used in performance testing to monitor and measure the behavior of a system under load. They provide valuable insights into various system components, such as CPU usage, memory consumption, disk I/O, and network activity. By analyzing these counters, testers can identify bottlenecks, evaluate system performance, and ensure the application meets its required performance benchmarks.
#70. How would you measure the server resource utilization during performance testing?
To measure server resource utilization during performance testing, various tools and techniques can be employed to track essential performance counters. One common approach is to use monitoring tools like Windows Performance Monitor, Linux’s `top` or `htop` commands, or third-party solutions like Nagios, Dynatrace, or New Relic. These tools collect detailed metrics on CPU usage, memory utilization, disk activity, and network throughput in real-time. It is important to establish baseline measurements under normal load conditions for comparison against the results obtained during testing. Additionally, logging critical metrics during test execution helps in identifying trends or anomalies. Automated scripts can also be utilized to gather and analyze server data, ensuring a consistent and repeatable process to evaluate resource utilization accurately.
#71. What is the role of caching in performance testing?
Caching plays a crucial role in performance testing as it directly impacts the speed and efficiency of data retrieval. By temporarily storing frequently accessed data, caching reduces the need for repeated requests to the underlying storage or database, thereby decreasing response times and easing the load on back-end systems. During performance testing, it is essential to analyze how caching mechanisms affect system behavior under varying loads. This includes testing scenarios both with and without caching enabled to understand its effectiveness as well as identifying potential bottlenecks. Furthermore, properly configured caching ensures optimal resource utilization, making it a key factor in achieving high performance while maintaining system reliability.
#72. How to Perform Performance Testing for Mobile Applications
To ensure the optimal performance of a mobile application, follow these steps:
- Define Performance Metrics: Identify key performance indicators (KPIs), such as load time, responsiveness, battery consumption, memory usage, and network efficiency.
- Set Up a Realistic Test Environment: Use physical devices or emulators that match your target audience’s device and OS configurations. Simulate real-world network conditions, including 3G/4G, Wi-Fi, and weak or unstable connections.
- Utilize Performance Testing Tools: Leverage tools such as Firebase Test Lab, Apache JMeter, Appium, or BrowserStack to automate testing and gather data effectively.
- Test Across Various Scenarios: Create and execute test cases that evaluate the app’s behavior under different workloads, such as high user traffic, multitasking, or background processes.
- Monitor Resource Consumption: Track CPU usage, memory consumption, and battery drain during operation to ensure efficiency.
- Analyze and Document Results: Collect data from test reports to identify bottlenecks and address issues. Repeat testing after each fix to validate improvements.
- Perform Continuous Testing: Reassess app performance after every update or release to maintain consistent quality and support for new devices or OS changes.
#73. How do you measure the throughput of a web service in performance testing?
To measure the throughput of a web service in performance testing, you need to monitor the number of requests processed by the service over a specific period of time—typically measured in requests per second (RPS) or transactions per second (TPS). The following steps outline the process:
- Set Up a Test Environment: Ensure the test environment closely mirrors the production environment to obtain accurate and reliable results.
- Choose a Testing Tool: Utilize tools such as JMeter, LoadRunner, or Gatling to simulate realistic load and measure throughput metrics effectively.
- Define Test Scenarios: Establish specific test scenarios based on typical user behavior, including concurrent users, request types, and workflows.
- Run Load Tests: Perform load tests by gradually increasing the level of traffic to identify the service’s maximum throughput and determine the saturation point.
- Monitor Metrics: Collect performance metrics such as the number of successful requests, response times, and error rates during the test.
- Analyze Results: Evaluate the data to deduce the service’s throughput, understanding how effectively it handles concurrent requests and peak load.
By carefully measuring throughput, you can gain insights into the performance efficiency of the web service and identify areas for optimization to meet user demand.
#74. How do you perform performance testing for microservices architecture?
Performance testing for a microservices architecture involves several steps to ensure the reliability, stability, and efficiency of the distributed system:
- Understand the Architecture: Begin by mapping out the architecture, identifying all the microservices, their dependencies, and communication patterns. This understanding is crucial to simulate realistic usage scenarios.
- Define Test Scenarios: Create specific test scenarios based on the business workflows and user interactions. Incorporate edge cases, high-concurrency scenarios, and peak load conditions to ensure the system is thoroughly tested.
- Isolate and Test Independently: Test each microservice in isolation to evaluate its performance. This includes stress tests that push the individual service to its limits to identify bottlenecks and breakpoints.
- Simulate Real-World Load: Use tools like JMeter, Locust, or Gatling to simulate traffic patterns that reflect real-world usage and interactions between microservices. Take into account the asynchronous communication and inter-service dependencies.
- Monitor Metrics in Real-Time: Collect key metrics such as latency, response time, request throughput, memory usage, and CPU utilization during the tests. Real-time monitoring is vital to detect problematic services or resource constraints early.
- Test Communication Protocols: Evaluate the performance of communication protocols (e.g., REST, gRPC, or messaging queues) to ensure they are optimized and do not become a bottleneck for inter-service communication.
- Test for Fault Tolerance: Perform resilience testing by simulating service failures, network delays, or connection drops. Verify the system’s ability to recover gracefully without significant performance degradation.
- Analyze and Optimize: Analyze the collected metrics and logs to identify bottlenecks or inefficiencies. Collaborate with developers to optimize code, database queries, or service configurations as needed.
By following these steps, performance testing in a microservices architecture can help ensure high availability, scalability, and seamless user experiences even under demanding conditions.
#75. What are the advantages and disadvantages of using real user monitoring (RUM) in performance testing?
Advantages of Using Real User Monitoring (RUM)
- Accurate User Insights: RUM collects data directly from users interacting with the application, providing real-world performance metrics that represent actual user experiences.
- Comprehensive Coverage: It captures performance data from diverse devices, browsers, and network conditions, offering a more holistic view of how different users experience the service.
- Proactive Issue Detection: By continuously monitoring user sessions, RUM can help identify performance bottlenecks and errors as they occur, enabling quicker resolution.
- Improved User Experience: With actionable insights from real data, organizations can better optimize their applications, resulting in enhanced user satisfaction.
- High Scalability: Since it works passively in real-time, RUM scales well with increasing user traffic without requiring additional configurations.
Disadvantages of Using Real User Monitoring (RUM)
- Lack of Controlled Testing: RUM only collects data from real users, limiting its ability to simulate hypothetical scenarios or test potential fixes in isolation.
- Delayed Feedback: Insights from RUM depend on actual user activity, which may cause delays in detecting issues if there is low user traffic during a specific period.
- Potential Data Overload: The constant collection of detailed data can lead to overwhelming amounts of information, requiring robust tools to analyze and filter relevant metrics.
- Privacy Concerns: RUM involves tracking real user behavior, which raises concerns about data privacy and compliance with regulations like GDPR or CCPA.
- Limited Debugging Capabilities: While RUM identifies performance issues, it doesn’t inherently provide in-depth diagnostics or root cause analysis, often requiring complementary tools for deeper insights.
#76. How do you identify and analyze the root cause of performance bottlenecks?
Identifying and analyzing the root cause of performance bottlenecks involves a systematic approach that combines monitoring, analysis, and debugging tools. Here are key steps to effectively pinpoint and resolve such issues:
- Establish Baselines: Start by defining performance benchmarks and key metrics to identify deviations. Use historical data or simulate standard workloads to create these baselines.
- Leverage Monitoring Tools: Implement performance monitoring tools, such as Application Performance Monitoring (APM) systems, to track metrics like server response times, network latency, and user interaction delays in real time.
- Isolate Problem Areas: Use tools like Real User Monitoring (RUM) and synthetic testing to narrow down potential problem zones. These may include front-end inefficiencies, server-side processing delays, or database bottlenecks.
- Perform Deep Diagnostics: Utilize profiling and debugging tools to investigate code-level or database-level issues. Analyzing logs, querying slow SQL statements, and examining thread dumps can provide critical insights.
- Replicate the Issue: Reproduce the performance bottleneck in a testing or staging environment to better understand the underlying causes without affecting live users.
- Optimize and Iterate: Once the root cause is found—for example, excessive API calls, unoptimized queries, or JavaScript inefficiencies—apply targeted fixes. Continuously monitor and test after changes to verify improvements.
By following these steps, teams can systematically identify and resolve performance bottlenecks, ensuring a seamless and optimized user experience.
#77. What are the challenges of performance testing for AI-driven applications?
Performance testing for AI-driven applications comes with a unique set of challenges due to their complex nature. One significant hurdle is the unpredictability of AI models, as their performance depends on factors like data quality, model architecture, and training processes. Unlike traditional software, AI systems often involve non-deterministic behavior, making it difficult to predict outcomes under varying conditions. Additionally, AI-driven applications typically require substantial computational resources, which can complicate scalability testing and stress simulations. Another challenge lies in replicating real-world usage scenarios, as AI systems often interact dynamically with diverse and evolving datasets. Ensuring fairness, avoiding bias, and accurately measuring the latency of decisions are also critical aspects that add to the complexity of performance testing for AI applications. These challenges necessitate a tailored approach to testing to guarantee reliability and efficiency in AI-powered systems.
#78. What is Load Balancing in Performance Testing?
Load balancing is a critical concept in performance testing, designed to distribute workloads evenly across multiple servers or resources. This ensures that no single server becomes overwhelmed, optimizing system performance, reliability, and scalability. By effectively managing traffic, load balancing helps maintain consistent user experiences, even during high-demand periods.
#79. What is the role of APM (Application Performance Monitoring) tools in performance testing?
APM tools play a vital role in performance testing by providing detailed insights into the performance and behavior of applications. These tools monitor key metrics such as response times, error rates, transaction throughput, and resource utilization, helping testers identify performance bottlenecks and underlying issues. APM tools also offer real-time visibility into applications running in complex environments, enabling precise diagnostics and faster resolution of problems. By integrating APM tools into performance testing, teams can ensure their applications are optimized for scalability, reliability, and overall user satisfaction.
#80. What are the key considerations for performance testing of e-commerce applications?
Performance testing of e-commerce applications is crucial to ensure a seamless customer experience and efficient system operation, especially during peak traffic periods. Below are the key considerations:
- Load Testing: Simulate expected user traffic to evaluate how the application performs under normal and peak conditions. Identify any slow pages or processes that could impact user experience.
- Scalability Testing: Assess the application’s ability to handle increased loads and ensure it can scale as the user base grows or during high-demand events like sales and promotions.
- Response Time: Measure the time taken by the application to load pages, process transactions, and respond to customer inputs. The goal is to meet industry standards and optimize for fast interactions.
- Stress Testing: Push the system beyond its expected limits to determine breaking points and ensure the application can gracefully recover from extreme stress scenarios.
- Integration Testing: Test interactions between multiple systems, such as payment gateways, inventory databases, and shipping platforms, to ensure smooth workflows.
- Mobile and Cross-Browser Performance: With the increasing number of mobile shoppers, evaluate the application’s performance across various devices and browsers to maintain compatibility and usability.
- Caching and CDNs: Analyze the effectiveness of caching strategies and Content Delivery Networks (CDNs) to reduce server load and improve content delivery speeds.
- Security Testing: Evaluate the application for vulnerabilities under load conditions, safeguarding sensitive customer information and preventing breaches during high-traffic scenarios.
By addressing these considerations, e-commerce applications can deliver reliable and robust performance, building trust and retaining customers.
#81. How do you identify memory leaks during performance testing?
Memory leaks can be identified during performance testing by closely monitoring the application’s memory usage over time. Key steps include:
- Utilizing Performance Monitoring Tools: Employ tools like JProfiler, VisualVM, or built-in application performance monitoring software to track memory usage patterns and identify anomalies.
- Analyzing Long-Running Tests: Run the application under sustained workloads for extended periods. Memory leaks typically manifest as a gradual, unexplained increase in memory usage that does not subside even when the load is reduced.
- Observing Garbage Collection Behavior: Monitor the frequency and effectiveness of garbage collection. A memory leak often results in ineffective garbage collection, with memory not being reclaimed as expected.
- Identifying Retained Objects: Use memory profiling tools to locate objects that persist in memory longer than anticipated, even after they are no longer required.
By systematically addressing these indicators, testers can pinpoint and address the root causes of memory leaks before they impact the application’s performance in production.
#82. What is the purpose of a performance testing environment?
A performance testing environment is designed to simulate real-world conditions under which an application will operate, enabling teams to assess its behavior and performance metrics. The primary purpose of this environment is to identify potential bottlenecks, ensure system stability, and measure responsiveness under varying load conditions. By closely mirroring the production environment, it allows accurate evaluation of hardware, software, and network configurations. This controlled testing space helps uncover issues such as high latency, resource contention, or scalability limitations, ensuring that the application can handle user demands efficiently before deployment.
#83. Why is JMeter Used For?
JMeter is primarily used for performance testing and load testing of web applications, APIs, and other services. It allows testers to validate the stability, scalability, and reliability of a system under varying levels of load. By simulating multiple users or requests, JMeter helps identify bottlenecks, measure response times, and ensure the application can handle real-world traffic conditions. Additionally, JMeter is often utilized for functional testing, ensuring the correct behavior of APIs and web services. Its ability to generate detailed reports and integrate with CI/CD pipelines makes it an essential tool in the software development lifecycle.
#84. What are the best approaches to simulating realistic loads in performance testing?
- Identify key user scenarios to determine the most common actions performed by users on the system.
- Use real-world data about usage patterns, including peak traffic times and concurrent user behavior.
- Employ performance testing tools, such as JMeter, LoadRunner, or Gatling, to simulate virtual users and their interactions with the system.
- Incorporate varied data inputs to mimic diverse user behaviors and conditions during testing.
- Gradually increase load levels to simulate scaling and monitor how the system handles stress over time.
- Include think-time for virtual users to replicate realistic delays between user actions.
- Test with different network conditions, such as varying bandwidth and latency, to emulate a range of user environments.
- Run tests on real devices, if applicable, to account for hardware and software variations.
- Use the results to refine scenarios and ensure the simulation reflects actual user activities accurately.
#85. What is the purpose of a performance testing framework?
A performance testing framework is designed to evaluate the efficiency, stability, scalability, and responsiveness of a system under various conditions. It provides a structured approach to simulate real-world user interactions, measure system performance, and identify potential bottlenecks or areas for improvement. By utilizing this framework, teams can ensure that software meets predefined performance criteria, supports expected user loads, and remains reliable across different environments. Additionally, it enables consistent reporting and analysis, helping developers and stakeholders make informed decisions to optimize system performance.
#86. Explain the concept of think time in performance testing?
Think time refers to the simulated delay or pause a user takes between consecutive actions while interacting with a system or application during performance testing. This concept mirrors real-world user behavior, as actual users typically require time to read content, make decisions, or complete steps before proceeding to the next action. Incorporating think time into performance tests is crucial for creating realistic usage patterns, ensuring that test scenarios reflect actual user interactions. By accurately modeling think time, testers can better predict system performance under typical user conditions and avoid overestimating system load due to unrealistic, continuous action sequences. This leads to more reliable and actionable insights into the system’s capabilities.
#87. How do you perform performance testing for cloud-based applications?
Steps to perform performance testing for cloud-based applications are as follows.
- Define Objectives and Key Metrics: Start by identifying the objectives of the performance testing. Determine key performance indicators (KPIs) such as response time, throughput, scalability, and system availability that need to be measured.
- Select the Right Tools: Choose performance testing tools designed for cloud environments. Popular tools include Apache JMeter, LoadRunner, and Gatling, which can simulate virtual users and analyze system performance.
- Design Realistic Test Scenarios: Create test scenarios that mimic real-world usage patterns, including varied user behaviors, geographical distribution, and simultaneous operations. Incorporate think time into these scenarios to emulate realistic user interactions.
- Provision Cloud Resources: Configure the cloud infrastructure to mirror the production environment. Leverage the on-demand scalability features of cloud platforms to allocate resources dynamically during the test.
- Conduct Load and Stress Testing: Perform load testing to determine how the application behaves under normal loads and stress testing to evaluate its limits under peak loads. Monitor key metrics like CPU usage, memory consumption, and response times during these tests.
- Analyze Results and Optimize: Analyze the data gathered to identify performance bottlenecks, such as latency issues or resource constraints. Use this information to optimize the application and infrastructure for better performance.
- Iterate and Revalidate: After making enhancements, repeat the testing process to ensure that the changes have resolved issues without introducing new ones. Revalidate to confirm improved performance under similar or increased load conditions.
By following these steps, teams can ensure their cloud-based applications perform reliably and efficiently in diverse and dynamic usage scenarios.
#88. What challenges arise in performance testing within cloud environments?
Performance testing in cloud environments introduces unique challenges due to the dynamic and distributed nature of these platforms. Below are some of the key challenges categorized into subtopics:
- Resource Variability: Cloud environments are inherently dynamic, with resources scaling up or down based on demand. This variability can cause inconsistencies in test results. The same performance test might yield different outcomes at different times due to fluctuating resource availability, making it harder to pinpoint the true performance of the application.
- Cost Management: While cloud platforms offer scalability, running extensive performance tests can incur significant costs. Prolonged tests that simulate high levels of user activity often require substantial computational power, storage, and bandwidth, which can lead to increased expenses. Balancing thorough testing with cost efficiency is a constant challenge.
- Environment Configuration: Replicating a production-like environment in the cloud for performance testing can be complex. Differences in network configurations, regional data centers, or virtual machine setups might not perfectly mimic real-world conditions, potentially compromising the accuracy of test results.
- Monitoring and Data Collection: Cloud environments typically include distributed resources and multiple components, making it challenging to monitor performance comprehensively. Gathering performance metrics across different nodes, services, or regions requires robust tools and strategies, which can add to the complexity of the testing process.
- Network Latency and Bandwidth: Since cloud services rely heavily on network communication, testing accurately under different network conditions is critical. Simulating real-world bandwidth limitations and managing latency between services are difficult yet vital aspects of ensuring performance reliability in cloud applications.
- Dynamic Scaling Effects: Cloud applications often rely on auto-scaling, a feature that dynamically adjusts resources based on traffic or workload. Testing how an application performs during scaling events, such as traffic spikes, can be challenging. Ensuring the system maintains stability and responsiveness during these transitions requires precise scenario modeling.
- Vendor-Specific Limitations: Each cloud provider has its own set of features, APIs, and limitations. These differences can create compatibility issues or necessitate platform-specific configurations for performance testing. Additionally, reliance on proprietary tools provided by vendors may limit flexibility.
Addressing these challenges requires careful planning, the use of advanced tools, and collaboration between testing teams and cloud service providers to ensure that performance testing in cloud environments yields meaningful and actionable results.
#89. What are Performance Counters in Performance Testing?
Performance counters are metrics used in performance testing to monitor and measure the behavior of a system under load. They provide valuable insights into various system components, such as CPU usage, memory consumption, disk I/O, and network activity. By analyzing these counters, testers can identify bottlenecks, evaluate system performance, and ensure the application meets its required performance benchmarks.
#90. How would you measure the server resource utilization during performance testing?
To measure server resource utilization during performance testing, various tools and techniques can be employed to track essential performance counters. One common approach is to use monitoring tools like Windows Performance Monitor, Linux’s `top` or `htop` commands, or third-party solutions like Nagios, Dynatrace, or New Relic. These tools collect detailed metrics on CPU usage, memory utilization, disk activity, and network throughput in real-time. It is important to establish baseline measurements under normal load conditions for comparison against the results obtained during testing. Additionally, logging critical metrics during test execution helps in identifying trends or anomalies. Automated scripts can also be utilized to gather and analyze server data, ensuring a consistent and repeatable process to evaluate resource utilization accurately.
#91. What is the role of caching in performance testing?
Caching plays a crucial role in performance testing as it directly impacts the speed and efficiency of data retrieval. By temporarily storing frequently accessed data, caching reduces the need for repeated requests to the underlying storage or database, thereby decreasing response times and easing the load on back-end systems. During performance testing, it is essential to analyze how caching mechanisms affect system behavior under varying loads. This includes testing scenarios both with and without caching enabled to understand its effectiveness as well as identifying potential bottlenecks. Furthermore, properly configured caching ensures optimal resource utilization, making it a key factor in achieving high performance while maintaining system reliability.
#92. How to Perform Performance Testing for Mobile Applications
To ensure the optimal performance of a mobile application, follow these steps:
- Define Performance Metrics: Identify key performance indicators (KPIs), such as load time, responsiveness, battery consumption, memory usage, and network efficiency.
- Set Up a Realistic Test Environment: Use physical devices or emulators that match your target audience’s device and OS configurations. Simulate real-world network conditions, including 3G/4G, Wi-Fi, and weak or unstable connections.
- Utilize Performance Testing Tools: Leverage tools such as Firebase Test Lab, Apache JMeter, Appium, or BrowserStack to automate testing and gather data effectively.
- Test Across Various Scenarios: Create and execute test cases that evaluate the app’s behavior under different workloads, such as high user traffic, multitasking, or background processes.
- Monitor Resource Consumption: Track CPU usage, memory consumption, and battery drain during operation to ensure efficiency.
- Analyze and Document Results: Collect data from test reports to identify bottlenecks and address issues. Repeat testing after each fix to validate improvements.
- Perform Continuous Testing: Reassess app performance after every update or release to maintain consistent quality and support for new devices or OS changes.
#93. How do you measure the throughput of a web service in performance testing?
To measure the throughput of a web service in performance testing, you need to monitor the number of requests processed by the service over a specific period of time—typically measured in requests per second (RPS) or transactions per second (TPS). The following steps outline the process:
- Set Up a Test Environment: Ensure the test environment closely mirrors the production environment to obtain accurate and reliable results.
- Choose a Testing Tool: Utilize tools such as JMeter, LoadRunner, or Gatling to simulate realistic load and measure throughput metrics effectively.
- Define Test Scenarios: Establish specific test scenarios based on typical user behavior, including concurrent users, request types, and workflows.
- Run Load Tests: Perform load tests by gradually increasing the level of traffic to identify the service’s maximum throughput and determine the saturation point.
- Monitor Metrics: Collect performance metrics such as the number of successful requests, response times, and error rates during the test.
- Analyze Results: Evaluate the data to deduce the service’s throughput, understanding how effectively it handles concurrent requests and peak load.
By carefully measuring throughput, you can gain insights into the performance efficiency of the web service and identify areas for optimization to meet user demand.
#94. How do you perform performance testing for microservices architecture?
Performance testing for a microservices architecture involves several steps to ensure the reliability, stability, and efficiency of the distributed system:
- Understand the Architecture: Begin by mapping out the architecture, identifying all the microservices, their dependencies, and communication patterns. This understanding is crucial to simulate realistic usage scenarios.
- Define Test Scenarios: Create specific test scenarios based on the business workflows and user interactions. Incorporate edge cases, high-concurrency scenarios, and peak load conditions to ensure the system is thoroughly tested.
- Isolate and Test Independently: Test each microservice in isolation to evaluate its performance. This includes stress tests that push the individual service to its limits to identify bottlenecks and breakpoints.
- Simulate Real-World Load: Use tools like JMeter, Locust, or Gatling to simulate traffic patterns that reflect real-world usage and interactions between microservices. Take into account the asynchronous communication and inter-service dependencies.
- Monitor Metrics in Real-Time: Collect key metrics such as latency, response time, request throughput, memory usage, and CPU utilization during the tests. Real-time monitoring is vital to detect problematic services or resource constraints early.
- Test Communication Protocols: Evaluate the performance of communication protocols (e.g., REST, gRPC, or messaging queues) to ensure they are optimized and do not become a bottleneck for inter-service communication.
- Test for Fault Tolerance: Perform resilience testing by simulating service failures, network delays, or connection drops. Verify the system’s ability to recover gracefully without significant performance degradation.
- Analyze and Optimize: Analyze the collected metrics and logs to identify bottlenecks or inefficiencies. Collaborate with developers to optimize code, database queries, or service configurations as needed.
By following these steps, performance testing in a microservices architecture can help ensure high availability, scalability, and seamless user experiences even under demanding conditions.
#95. What are the advantages and disadvantages of using real user monitoring (RUM) in performance testing?
Advantages of Using Real User Monitoring (RUM)
- Accurate User Insights: RUM collects data directly from users interacting with the application, providing real-world performance metrics that represent actual user experiences.
- Comprehensive Coverage: It captures performance data from diverse devices, browsers, and network conditions, offering a more holistic view of how different users experience the service.
- Proactive Issue Detection: By continuously monitoring user sessions, RUM can help identify performance bottlenecks and errors as they occur, enabling quicker resolution.
- Improved User Experience: With actionable insights from real data, organizations can better optimize their applications, resulting in enhanced user satisfaction.
- High Scalability: Since it works passively in real-time, RUM scales well with increasing user traffic without requiring additional configurations.
Disadvantages of Using Real User Monitoring (RUM)
- Lack of Controlled Testing: RUM only collects data from real users, limiting its ability to simulate hypothetical scenarios or test potential fixes in isolation.
- Delayed Feedback: Insights from RUM depend on actual user activity, which may cause delays in detecting issues if there is low user traffic during a specific period.
- Potential Data Overload: The constant collection of detailed data can lead to overwhelming amounts of information, requiring robust tools to analyze and filter relevant metrics.
- Privacy Concerns: RUM involves tracking real user behavior, which raises concerns about data privacy and compliance with regulations like GDPR or CCPA.
- Limited Debugging Capabilities: While RUM identifies performance issues, it doesn’t inherently provide in-depth diagnostics or root cause analysis, often requiring complementary tools for deeper insights.
#96. How do you identify and analyze the root cause of performance bottlenecks?
Identifying and analyzing the root cause of performance bottlenecks involves a systematic approach that combines monitoring, analysis, and debugging tools. Here are key steps to effectively pinpoint and resolve such issues:
- Establish Baselines: Start by defining performance benchmarks and key metrics to identify deviations. Use historical data or simulate standard workloads to create these baselines.
- Leverage Monitoring Tools: Implement performance monitoring tools, such as Application Performance Monitoring (APM) systems, to track metrics like server response times, network latency, and user interaction delays in real time.
- Isolate Problem Areas: Use tools like Real User Monitoring (RUM) and synthetic testing to narrow down potential problem zones. These may include front-end inefficiencies, server-side processing delays, or database bottlenecks.
- Perform Deep Diagnostics: Utilize profiling and debugging tools to investigate code-level or database-level issues. Analyzing logs, querying slow SQL statements, and examining thread dumps can provide critical insights.
- Replicate the Issue: Reproduce the performance bottleneck in a testing or staging environment to better understand the underlying causes without affecting live users.
- Optimize and Iterate: Once the root cause is found—for example, excessive API calls, unoptimized queries, or JavaScript inefficiencies—apply targeted fixes. Continuously monitor and test after changes to verify improvements.
By following these steps, teams can systematically identify and resolve performance bottlenecks, ensuring a seamless and optimized user experience.
#97. What are the challenges of performance testing for AI-driven applications?
Performance testing for AI-driven applications comes with a unique set of challenges due to their complex nature. One significant hurdle is the unpredictability of AI models, as their performance depends on factors like data quality, model architecture, and training processes. Unlike traditional software, AI systems often involve non-deterministic behavior, making it difficult to predict outcomes under varying conditions. Additionally, AI-driven applications typically require substantial computational resources, which can complicate scalability testing and stress simulations. Another challenge lies in replicating real-world usage scenarios, as AI systems often interact dynamically with diverse and evolving datasets. Ensuring fairness, avoiding bias, and accurately measuring the latency of decisions are also critical aspects that add to the complexity of performance testing for AI applications. These challenges necessitate a tailored approach to testing to guarantee reliability and efficiency in AI-powered systems.
#98. What is Load Balancing in Performance Testing?
Load balancing is a critical concept in performance testing, designed to distribute workloads evenly across multiple servers or resources. This ensures that no single server becomes overwhelmed, optimizing system performance, reliability, and scalability. By effectively managing traffic, load balancing helps maintain consistent user experiences, even during high-demand periods.
#99. What is the role of APM (Application Performance Monitoring) tools in performance testing?
APM tools play a vital role in performance testing by providing detailed insights into the performance and behavior of applications. These tools monitor key metrics such as response times, error rates, transaction throughput, and resource utilization, helping testers identify performance bottlenecks and underlying issues. APM tools also offer real-time visibility into applications running in complex environments, enabling precise diagnostics and faster resolution of problems. By integrating APM tools into performance testing, teams can ensure their applications are optimized for scalability, reliability, and overall user satisfaction.
#100. What is the Modular approach of scripting?
The modular approach of scripting involves breaking down a script into smaller, reusable, and independent modules or components. Each module represents a specific functionality or a set of related tasks, making it easier to maintain and update the script as required. By following this approach, scripting becomes more organized, scalable, and efficient. Modules can be combined or reused across different scripts, reducing redundancy and development time. This approach also simplifies debugging and enhances collaboration, as team members can work on individual modules without affecting the rest of the script.
#101. How are the steps validated in a Script?
Validating steps in a script is a crucial process to ensure accuracy, functionality, and reliability. This often involves testing each step or module individually to verify its expected behavior, a process known as unit testing. Developers may also use debugging tools to identify and resolve errors in the code. Additionally, implementing error-handling mechanisms helps ensure the script can account for unexpected inputs or system behaviors. Peer reviews and code walkthroughs are commonly conducted to check for logical flaws or inefficiencies. Finally, end-to-end testing can be performed to validate the full workflow of the script in its intended environment, ensuring the integration of all modules functions seamlessly.
#102. How to identify performance testing use cases for any application?
To identify performance testing use cases for any application, start by understanding the application’s architecture and its core functionalities. Break down the use cases into scenarios that reflect real-world user behavior and identify critical operations that may experience heavy loads, such as login processes, database queries, or payment transactions. Additionally, evaluate the expected user volume, peak usage times, and specific performance requirements like response time, throughput, and scalability.
Engage with stakeholders, including developers, product owners, and end users, to gather insights into areas of concern or historical bottlenecks. Analyze performance metrics from similar applications or past experiences to anticipate potential weak spots. Lastly, prioritize the use cases based on business impact and risk factors to ensure testing efforts focus on the most critical areas of the application under varying conditions.
#103. When is the right time to perform Performance Testing for Software?
Performance testing should be conducted at various stages of the software development lifecycle to ensure optimal functionality and user satisfaction. Ideally, it begins during the design phase, where architects can identify potential performance risks and incorporate mitigation strategies. As development progresses, testing should be performed incrementally, particularly after significant feature integrations, to identify and address issues early.
It is also crucial to conduct performance testing before major milestones like beta releases or production deployment. This allows teams to evaluate the software’s behavior under expected load conditions and ensure stability. Additionally, performance tests should be scheduled after any major changes, such as infrastructure updates, third-party service integrations, or database modifications, to assess the impact on the system. Regular performance testing during maintenance phases ensures that the software continues to meet performance benchmarks as usage patterns and environments evolve.
#104. Can the end-users of the application conduct performance testing?
End-users of the application typically do not conduct performance testing, as it requires specialized tools, environments, and expertise to simulate various load conditions accurately. Performance testing is usually carried out by development or QA teams who have access to the necessary resources and a thorough understanding of the system’s architecture. However, end-users can provide valuable feedback on perceived performance issues during real-world usage, which can aid the development team in identifying areas for improvement.
#105. What are the steps involved in conducting performance testing?
Steps involved in conducting Performance Testing are as follows
- Requirement Analysis: Begin by understanding the performance requirements of the application. This includes identifying key metrics such as response time, throughput, scalability, and resource utilization. Collaborate with stakeholders to define clear performance goals and acceptable thresholds.
- Test Environment Setup: Establish a test environment that closely mimics the production setup. This should include hardware, software, network configurations, and any necessary tools for monitoring and data collection.
- Test Case Design: Develop performance test cases based on real-world usage scenarios and workload models. These test cases should cover a range of conditions, from typical daily operations to peak load situations.
- Tool Selection: Choose appropriate performance testing tools that align with the requirements of your application. Popular tools include JMeter, LoadRunner, or Gatling based on the complexity and scale of the system.
- Test Execution: Execute the performance tests while monitoring the system’s behavior under different load conditions. Gradually increase the load to identify the application’s breaking point and observe how it handles stress.
- Data Analysis: Analyze the results to pinpoint bottlenecks, such as slow database queries, memory leaks, or network latency issues. Use this data to identify performance trends and areas for optimization.
- Issue Resolution: Work with the development and operations teams to address identified issues. This may involve code optimizations, database tuning, or upgrading hardware resources.
- Re-Testing: Conduct follow-up tests to validate the effectiveness of the fixes and ensure that performance has improved without introducing new issues.
- Reporting and Documentation: Summarize the findings in a detailed report, highlighting key metrics, identified issues, resolutions, and performance trends. Share this information with stakeholders to provide transparency and inform future optimization efforts.
#106. What are some of the best tips for conducting performance testing?
Best tips for conducting Performance Testing are as follows
- Define Clear Objectives: Establish specific goals and success criteria for performance testing to ensure testing aligns with the application’s business requirements and user needs.
- Choose the Right Tools: Select performance testing tools that suit your application’s technology stack, testing environment, and budget. Tools like JMeter, LoadRunner, or Gatling can be helpful.
- Test Realistic Scenarios: Simulate real-world user behavior and traffic patterns during testing to accurately assess the application’s performance under expected usage conditions.
- Baseline and Benchmark: Capture performance baselines before testing begins to use as a reference point. Regularly compare benchmarks to track progress over time.
- Monitor System Metrics: Continuously monitor server utilization, memory usage, CPU load, and other critical system metrics during tests to identify bottlenecks and inefficiencies.
- Test Early and Often: Incorporate performance testing into the early stages of development and carry it out frequently to catch issues early, when they are easier and less costly to fix.
- Automate Where Possible: Use automated performance testing to save time, reduce human error, and ensure consistent test execution, especially for regression tests.
- Analyze and Prioritize Issues: Focus on resolving high-impact performance issues first. Use comprehensive reports to assess severity and prioritize fixes based on user impact.
- Scale Testing Gradually: Start with small loads and increase them gradually to assess how the application handles incremental pressure. Avoid overloading the system immediately to prevent data skew.
- Document and Communicate Results: Clearly document key insights, bottlenecks, solutions, and improvements. Communicate findings to relevant stakeholders to ensure alignment and drive further optimizations.
By following these tips, performance testing can become a streamlined and effective process, ensuring your application is robust, scalable, and ready to deliver an optimal user experience.
#107. Why is it preferred to perform load testing in an automated format?
Automating load testing is preferred for several reasons. First, it allows for consistent and repeatable tests, eliminating the variability introduced by manual processes. Automated tools can simulate numerous concurrent users far beyond the scope of manual efforts, which is essential for assessing application scalability under heavy loads. Additionally, automation saves time by enabling tests to be run frequently and on-demand, especially in continuous integration/continuous deployment (CI/CD) pipelines. This ensures that performance issues are caught early in the development lifecycle. Furthermore, automated load testing provides detailed and real-time insights into system behavior, helping teams quickly identify bottlenecks and optimize performance with greater accuracy. Ultimately, automation enhances efficiency, accuracy, and scalability in the load testing process.
#108. What are the metrics monitored in performance testing?
When conducting performance testing, several critical metrics are monitored to evaluate the system’s efficiency, reliability, and scalability:
- Response Time: Measures the time taken by the system to respond to a specific request, often expressed in milliseconds or seconds.
- Throughput: Tracks the number of transactions processed by the system within a given time frame, reflecting the system’s capacity.
- CPU Utilization: Monitors the percentage of CPU resources consumed during the test to ensure the system performs within acceptable thresholds.
- Memory Usage: Keeps track of how much memory is used during operations to identify potential memory leaks or inefficiencies.
- Error Rate: Measures the percentage of requests that fail due to errors, highlighting reliability issues.
- Latency: Refers to the delay between a request and the beginning of the response, indicative of the system’s real-time performance.
- Disk I/O: Evaluates the speed and efficiency of data read/write operations on the disk, particularly under heavy load conditions.
- Disk Time: Tracks the percentage of time the disk is busy with read/write operations, reflecting storage performance under load.
- Bandwidth: Measures the amount of data transferred over a network, critical for evaluating network efficiency and capacity.
- CPU Interrupts per Second: Indicates how often the CPU is interrupted by hardware or software, providing insights into system responsiveness and operational efficiency.
- Amount of Connection Pooling: Assesses the reuse of existing database connections, crucial for improving performance and reducing overhead.
- Maximum Active Sessions: Monitors the highest number of active sessions at a given time, helping identify usage patterns and system scaling limitations.
- Hits per Second: Reflects the number of requests handled per second, gauging the performance and throughput of a web server or application.
- Thread Counts: Tracks the number of threads being executed, providing details about resource usage and application concurrency.
- Private Bytes: Measures the amount of memory allocated exclusively to a process, useful for identifying memory consumption by individual applications.
- Committed Memory: Monitors the total amount of virtual memory reserved by processes, offering insights into overall system memory usage.
- Memory Pages per Second: Tracks the rate at which pages are read from or written to the disk due to memory operations, signaling potential memory bottlenecks.
- Page Faults per Second: Measures the frequency at which the system retrieves data from virtual memory, which can indicate insufficient RAM or inefficient memory use.
Monitoring these metrics helps teams pinpoint performance issues, optimize system configurations, and ensure that the application meets established performance benchmarks.
#109. What are the pre-requisites to enter and exit a performance test execution phase?
Pre-requisites to enter performance test execution phase are:
- Test Environment Readiness: Ensure the test environment closely replicates the production environment, including hardware, software, network configurations, and data setup.
- Test Data Preparation: Load and prepare test data that resembles real-world scenarios to simulate actual system behavior.
- Test Plan and Scripts: Finalize the performance test plan, including the objectives, scope, and test scenarios. Validate and secure the performance test scripts.
- Tool Configuration: Configure and verify the performance testing tools to ensure they align with the test requirements.
- Clear Objectives: Define key performance indicators (KPIs), including response times, throughput, and system resource utilizations for clear benchmarking.
Pre-requisites to exit performance test execution phase are:
- Test Completion: Execute all planned test scenarios successfully without major test case failures or interruptions.
- Results Analysis: Analyze test results to identify bottlenecks and ensure the system meets the defined KPIs.
- Defect Resolution: Report and address critical performance-related defects identified during the test execution.
- Stakeholder Approval: Obtain validation from stakeholders confirming that the performance benchmarks have been satisfactorily achieved.
- Documentation: Prepare and share a detailed test summary report, including observations, findings, and recommendations for improvements.
#110. What is the purpose of ramp-up and ramp-down time in load testing?
The purpose of ramp-up time in load testing is to gradually increase the load on a system to simulate a realistic buildup of traffic, allowing the system to adjust and respond under controlled conditions. This helps identify bottlenecks, scalability issues, and performance thresholds without overwhelming the system abruptly. Conversely, ramp-down time is used to gradually decrease the load, ensuring that any ongoing processes are completed smoothly and providing insights into how the system recovers from high traffic. Together, these periods mimic real-world usage patterns and provide a comprehensive understanding of the system’s behavior under varying levels of stress.
#111. Explain the concept of database performance testing?
Database performance testing is the process of evaluating and analyzing the speed, reliability, and overall performance of a database under various workloads and conditions. This type of testing ensures that the database can handle a specified number of concurrent users while maintaining optimal response times and processing efficiency. Key aspects of database performance testing include measuring query execution times, assessing transaction throughput, evaluating indexing efficiency, and verifying the effectiveness of caching mechanisms. By simulating real-world scenarios, database performance testing helps identify bottlenecks, optimize configurations, and prevent potential issues before deployment, ensuring the database meets the performance requirements of the application it supports.
#112. Describe the term “Bottlenecks” in a Software?
A bottleneck in software refers to a point within a system where the performance or efficiency is significantly limited compared to other components. This can occur due to restricted processing capacity, limited memory resources, or delayed input/output operations. Bottlenecks often cause a slowdown in the overall system, as they prevent data or tasks from flowing efficiently through the software. Identifying and addressing bottlenecks is crucial for optimizing performance, as these issues can impact application responsiveness, user experience, and scalability. Common examples include slow database queries, overloaded servers, or poorly optimized algorithms.
#113. Describe your overall performance testing experience?
My overall performance testing experience has been both insightful and rewarding. I have worked extensively on identifying bottlenecks in various stages of application development, employing tools such as JMeter, LoadRunner, and other benchmarking software to measure system responsiveness under different levels of load. My expertise lies in designing comprehensive test plans that simulate real-world usage, allowing for accurate analysis of an application’s behavior under stress. Throughout my career, I have collaborated with development teams to pinpoint and resolve issues like slow response times, memory leaks, and inefficient database queries, ultimately improving user satisfaction and system scalability.
#114. How to identify performance testing use cases for any application?
To identify performance testing use cases for any application, it is essential to first understand the application’s purpose and the critical workflows it supports. Start by analyzing the business requirements and user expectations to pinpoint key functionalities that demand optimal performance. Consider scenarios such as peak user load, concurrent access, and data-heavy operations, as these often represent potential bottlenecks. Collaborate with stakeholders, including developers, business analysts, and end-users, to gather insights on areas where performance is most critical. Additionally, examine historical data, if available, to identify patterns in user behavior and peak usage times. Breaking down these use cases ensures a targeted and efficient approach to performance testing, aligning the effort with the application’s most impactful areas.
#115. What type of test data is used for performance testing?
When conducting performance testing, the type of test data used is critical to accurately simulate real-world scenarios. Common types of test data include realistic datasets that mirror actual user data to replicate genuine application usage. This can include customer records, transaction logs, or other operational data. Synthetic data may also be generated to simulate specific loads or edge cases that are challenging to observe in production. Additionally, test environments often make use of anonymized or obfuscated production data to maintain privacy and security while ensuring realism. The goal is to ensure the test data aligns with the application’s expected operational behavior, helping to uncover performance limitations under different conditions.
#116. What performance testing tools have you used in the past?
Some of the performance testing tools commonly used include JMeter, which is popular for load testing and measuring application performance under different conditions. LoadRunner is another comprehensive tool used to simulate a large user load and monitor system behavior. Gatling is an open-source tool known for its efficiency in simulating heavy traffic for web applications. Additionally, tools like Apache Bench, BlazeMeter, and Neoload are often employed depending on the specific testing requirements and the system under evaluation. Each tool offers unique features, making them suitable for various testing scenarios.
#117. What would you recommend to application developers if their site crashed with a low user load during a stress test?
If an application crashes under low user load during a stress test, developers should first examine the system’s error logs to identify potential issues such as misconfigurations, coding errors, or resource constraints. It is essential to review the server configuration to ensure sufficient CPU, memory, and storage is allocated to handle the traffic. Additionally, developers should verify the efficiency of the database queries and optimize them to reduce bottlenecks. Conducting a code review to identify inefficient algorithms or unhandled exceptions can also help pinpoint the problem. Lastly, running the application in a controlled environment with profiling tools can provide deeper insights into the performance issues and guide the implementation of corrective actions.
#118. During a stress test, if the application crashes with a low user load, what should the developers do?
If the application crashes during a stress test with a low user load, developers should first examine the application’s logs to identify any error messages or patterns that might reveal the root cause. Next, they should inspect the system resources such as CPU, memory, and disk usage to determine if resource limits are being exceeded. Debugging tools can help identify potential memory leaks, unhandled exceptions, or infinite loops within the code. Additionally, developers should check for configuration issues, such as incorrect load balancer or database settings, which could impact application stability. Performing targeted unit tests on critical modules and gradually increasing the load during subsequent tests can help isolate the problem and assess when the crash occurs.
#119. What kind of performance testing would you use to prepare for a website launch?
To prepare for a website launch, several types of performance testing should be conducted to ensure optimal functionality and user experience. Load testing is essential to determine how the website behaves under expected traffic levels, ensuring it can handle the projected amount of concurrent users. Stress testing goes a step further by identifying the website’s breaking point under extreme conditions of traffic or resource constraints, revealing potential vulnerabilities. Additionally, scalability testing helps evaluate whether the website can effectively scale up or down in response to varying user demands. Endurance testing should also be performed to assess the website’s stability and reliability during prolonged periods of usage. Lastly, browser and device compatibility testing ensures the website performs consistently across various platforms and devices, providing a seamless experience for all users.
#120. What does a long response time mean in performance testing?
A long response time in performance testing typically signifies that the system under test is struggling to handle requests efficiently. This can be the result of several factors, such as insufficient server resources, poorly optimized code, high network latency, or database bottlenecks. When response times are extended, it can negatively affect the user experience, leading to frustration and potential abandonment of the website or application. Identifying and addressing the root causes of long response times is critical to ensuring the system can perform reliably under expected load conditions.
#121. When do you use hardware tuning versus software tuning?
Hardware tuning is typically employed when the existing hardware resources are insufficient to meet the demands of the system. This might include upgrading CPU capacity, increasing RAM, or adding faster storage solutions to handle higher data throughput or reduce processing bottlenecks. It is often used when the issue stems from a lack of physical resources and scaling up is a cost-effective and immediate solution.
On the other hand, software tuning is used when inefficiencies stem from the application, database configuration, or code itself. This approach involves optimizing algorithms, improving database indexing, or refactoring poorly written code to make the system run more efficiently without additional hardware investments. Software tuning is generally suitable for addressing performance issues related to logic or inefficiency in application design. Determining whether hardware or software tuning is required depends on analyzing the system’s performance metrics to identify the root cause. Often, a combination of both strategies may yield the best results.
#122. Give examples of performance test requirements for a mobile phone game application?
- Frame Rate Stability: The game should maintain a consistent frame rate (e.g., 60 FPS or higher) during gameplay to ensure smooth visual performance without stuttering or lag.
- Loading Time: Levels or assets should load within an acceptable time frame (e.g., under 5 seconds) to maintain player engagement and satisfaction.
- Battery Consumption: The application should be optimized to consume minimal battery power during extended gameplay sessions.
- Memory Usage: The game should avoid excessive memory usage to prevent crashes or slowdowns on devices with lower specifications.
- Network Performance: For online multiplayer games, latency should be kept low, and the game should function seamlessly under varying network conditions, including low bandwidth or intermittent connectivity.
- Compatibility: The game must perform consistently across multiple device models, screen resolutions, and operating system versions within the target audience.
#123. How do you determine the cause of decreased system performance?
Determining the cause of decreased system performance involves a structured diagnostic approach. First, monitor system resource usage, such as CPU, memory, and disk I/O, using tools like Task Manager or performance monitors to identify any bottlenecks. Check for background processes or applications consuming excessive resources. Additionally, review error logs and crash reports to pinpoint software issues. Conduct network diagnostics to ensure that connectivity problems are not contributing to the performance decline. For games, profiling tools can be used to analyze frame rates, rendering times, and script execution to locate inefficiencies. Testing the application on different devices and configurations may also help isolate reproducible issues. Regularly updating systems and software ensures known bugs or compatibility issues are addressed, further aiding in identifying the root cause of performance slowdowns.
#124. When do you need to stop a performance test?
Stopping a performance test is necessary when specific conditions are met or objectives have been achieved. Typically, a performance test should conclude once all predefined testing goals, such as reaching target response times, ensuring scalability, or meeting stability under peak load, have been accomplished. Additionally, tests may stop if critical system thresholds, such as CPU or memory utilization, are exceeded, indicating a need for optimization before further testing. It is also appropriate to end the test if results consistently demonstrate reliability and no significant bottlenecks are observed. However, stopping prematurely can lead to incomplete data, so it is essential to ensure that thorough analysis has been conducted before concluding the test.
#125. What is a dry run?
A dry run is a preliminary test or simulation conducted to verify a process, procedure, or system without executing it in a live environment. It is used to identify potential issues, confirm functionality, and ensure that all components are working as intended before a full-scale deployment or testing phase. Dry runs are commonly performed in software development, event planning, and various technical fields, allowing teams to refine their approaches and fix errors in a controlled setting. This exercise helps mitigate risks and enhances the chances of success in real-world scenarios.
#126. How often do you repeat performance tests?
The frequency of performance tests depends on the specific requirements of the project, the nature of the system being tested, and any changes implemented. Generally, performance tests are repeated after significant updates, configuration changes, or code modifications to ensure the system continues to meet performance standards. Regularly scheduled tests, such as weekly or monthly, can also be beneficial for systems with high usage or where consistency is critical. Ultimately, the goal is to identify and address performance bottlenecks before they escalate into larger issues, ensuring reliability and efficiency over time.
#127. Describe your experience with volume testing?
Volume testing has been an integral part of my approach to ensuring system reliability under heavy data loads. I have utilized this technique to evaluate how applications handle varying levels of data input over extended periods. One notable project involved testing a database system’s ability to manage millions of records efficiently without compromising performance. By simulating high data loads, I was able to identify memory usage patterns and pinpoint areas that required optimization, such as query execution times and indexing strategies. This proactive testing ultimately helped prevent bottlenecks and ensured the system’s scalability to support future growth.
#128. Define protocol-based performance testing and explain its benefits?
Protocol-based performance testing involves evaluating the performance of a system by simulating real-world communication protocols that it relies on, such as HTTP, FTP, or TCP/IP. This type of testing focuses on how well a system performs under specific protocol conditions, identifying potential bottlenecks or inefficiencies at the network or communication level.
The benefits of protocol-based performance testing include ensuring reliable data transmission, validating system response times, and uncovering issues that may arise under varying loads or network conditions. By analyzing how the system interacts with specific protocols, organizations can optimize performance, enhance user experiences, and ensure system resilience during peak usage or in complex environments.
#129. Explain garbage collection in relation to performance testing?
Garbage collection is a critical process in software applications, designed to automate memory management by reclaiming memory occupied by objects no longer in use. In the context of performance testing, understanding and monitoring garbage collection is essential as it directly impacts application performance. Inefficient garbage collection can lead to high CPU usage, memory leaks, or application stalls, resulting in degraded user experiences. During performance testing, tools and metrics are used to track the frequency and duration of garbage collection events, ensuring that the application can handle expected loads without excessive pauses or system bottlenecks. By evaluating garbage collection behavior, testers can identify and resolve memory management issues, optimize resource utilization, and ensure that the application maintains stability and responsiveness under varying conditions.
#130. What tool would you use to simulate a high volume of user access requests at the same time?
To simulate a high volume of user access requests at the same time, tools like Apache JMeter, Gatling, or Locust are often utilized. These performance testing tools allow testers to generate concurrent virtual users, configure various request patterns, and analyze the application’s response under stress. Among these, Apache JMeter is widely recognized for its versatility, offering features to test web applications, APIs, and more. Gatling provides a developer-friendly environment with its Scala-based scripting, while Locust is known for its lightweight and Python-based framework, making it easy to define user behaviors. Each tool serves to stress-test applications and identify performance bottlenecks effectively.
#131. What are the signs of a disk usage bottleneck?
Signs of a disk usage bottleneck can manifest in various ways, often impacting system performance noticeably. One common indicator is increased disk queue length, where read and write requests take longer to process due to high demand. Another sign is a consistent spike in disk utilization, with the disk operating at or near its maximum capacity. Slow file read/write speeds and delayed application responses may also signal a bottleneck. Additionally, frequent timeouts or errors during data access operations, as well as elevated CPU usage caused by processes waiting for disk I/O, can point to a disk-related performance issue. Monitoring tools can provide deeper insights into these metrics, helping to identify and resolve the bottleneck efficiently.
#132. How do you determine if your CPU can handle a stress test?
To determine if your CPU can handle a stress test, begin by monitoring its performance under normal operating conditions. Use diagnostic tools to check current CPU temperatures, clock speeds, and usage levels. Before initiating the stress test, ensure adequate cooling systems are in place, such as functional fans or liquid cooling, to prevent overheating. During the stress test, observe the CPU’s temperature, stability, and performance metrics. If the temperature exceeds safe operating limits or the system becomes unstable, it indicates that the CPU may be struggling to handle the workload. Additionally, benchmarking software can provide detailed performance reports, allowing you to compare results against standard thresholds for your specific CPU model. Regular monitoring and maintenance can help optimize your CPU’s ability to endure intensive tasks.
#133. What kind of visual aids typically include in the performance test reports?
Performance test reports typically include several types of visual aids to help illustrate and analyze the data effectively. Common visual aids include bar graphs, which compare performance metrics such as processing speed or power consumption across different tests. Line charts are often used to display trends over time, such as temperature fluctuations or clock speeds under varying workloads. Pie charts may be included to show the distribution of resource usage, while scatter plots can highlight correlations between variables like load intensity and performance. Additionally, heat maps are used to visually represent areas of high and low activity within the system, and tables consolidate raw data for quick reference. These visual aids make it easier to identify patterns, anomalies, and areas for improvement at a glance.
FAQs – Performance Testing Interview Questions
Is performance testing good for a career?
Yes, performance testing is a promising career path for those interested in software quality and system optimization. It ensures applications meet scalability, reliability, and speed requirements, making performance testers highly valued by organizations. With growing demand, evolving technologies like cloud computing, and competitive salaries (6+ LPA in India, $107k in the USA), this field offers excellent career growth and opportunities with top companies like TCS, Capgemini, and Infosys.
How long will it take to learn performance testing?
The time it takes to learn performance testing can vary depending on your background and dedication. If you already have a basic understanding of software testing and programming, you could grasp the fundamentals of performance testing in about 4-6 weeks with consistent effort. For beginners, it might take 2-3 months to become comfortable with the core concepts, tools like JMeter or LoadRunner, and scripting techniques. Mastery, including advanced skills like analyzing complex performance metrics and integrating performance testing into DevOps workflows, may require several months to a year of practical experience and continuous learning. The key is hands-on practice and real-world project exposure.
Is learning performance testing easy?
Learning performance testing can vary in difficulty depending on your background and willingness to invest time. For individuals with a basic understanding of software development or testing concepts, it may feel relatively straightforward to grasp the fundamentals. However, mastering performance testing involves learning various tools, understanding performance metrics, scripting, and interpreting results effectively. Challenges may arise in analyzing complex system behavior and optimizing performance across diverse environments. With dedication, hands-on practice, and access to good resources, learning performance testing can become a manageable and rewarding skill.
What are the skills required for performance testers?
Performance testers require a blend of technical and analytical skills to excel in their role. Key skills include:
Proficiency in Performance Testing Tools: Familiarity with tools like JMeter, LoadRunner, Gatling, or NeoLoad is essential for executing and analyzing test scenarios effectively.
Understanding of Performance Metrics: Knowledge of response time, throughput, latency, error rates, and other metrics to evaluate system performance.
Scripting Expertise: Ability to create and modify test scripts in languages such as Java, Python, or JavaScript to simulate user behavior.
Analytical Thinking: Strong problem-solving skills to identify bottlenecks, analyze root causes, and propose optimization strategies.
Knowledge of System Architecture: Awareness of databases, servers, networks, and cloud environments to understand performance impacts.
Collaboration and Communication: Working with developers, DevOps teams, and stakeholders to align on performance goals and findings.
Attention to Detail: Precision in testing to uncover subtle performance issues that can impact user experience.
A combination of these technical and interpersonal abilities helps performance testers ensure robust and efficient systems.
Conclusion
Preparing for performance testing interviews doesn’t have to feel overwhelming. With the right knowledge and understanding of core concepts, you can showcase your skills effectively. Remember to focus on both the technical aspects and practical applications, as they go hand-in-hand during interviews. We hope this Performance Testing Interview Questions and Answers guide simplifies your preparation and equips you with the confidence to tackle any performance testing question that comes your way. Best of luck!
Related posts:
- JMeter Interview Questions
- Manual Testing Interview Questions
- Selenium Interview Questions
- Agile Interview Questions
- Performance Testing Guide
- Load Testing Guide
- Penetration Testing Guide
- Performance Testing Tools
- Penetration Testing Tools